Grafana’s graph visualization capabilities are frequently used by organizations that need quick visibility into system metrics and performance trends. While the platform supports a range of...
Continue Reading
Grafana’s graph visualization capabilities are frequently used by organizations that need quick visibility into system metrics and performance trends. While the platform supports a range of...
Continue Reading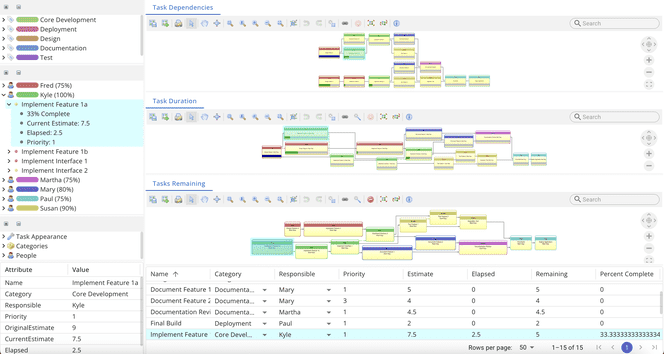
What Is Dependency Graph Visualization? Dependency graph visualization represents the relationships between various components in a system using graphical diagrams. These graphs provide a...
Continue Reading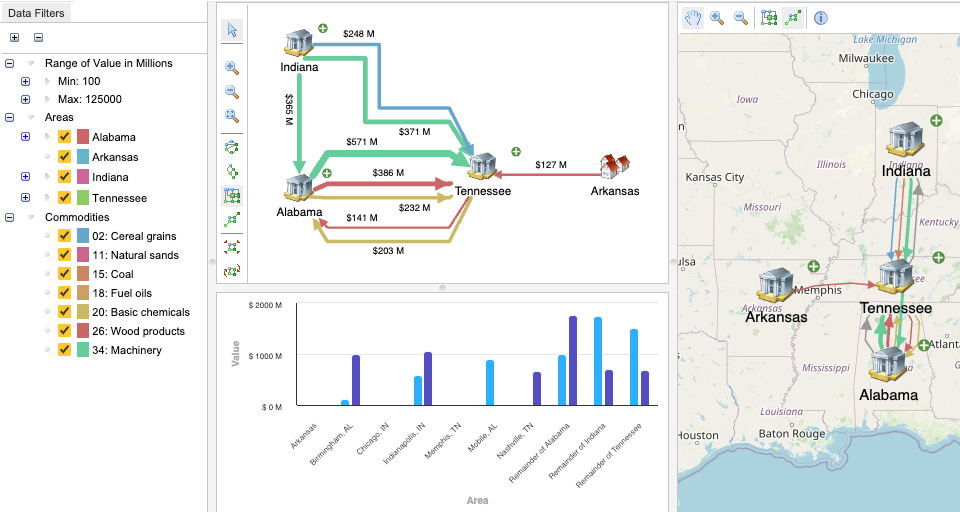
Graph data structures are well-suited for modeling complex systems, but their full potential is unlocked only when users can interact with them in real-time. Interactive graph visualization...
Continue ReadingDot Graph Visualization is a method for illustrating complex systems using the DOT language—a lightweight, plain-text format purpose-built for graph descriptions.
Continue Reading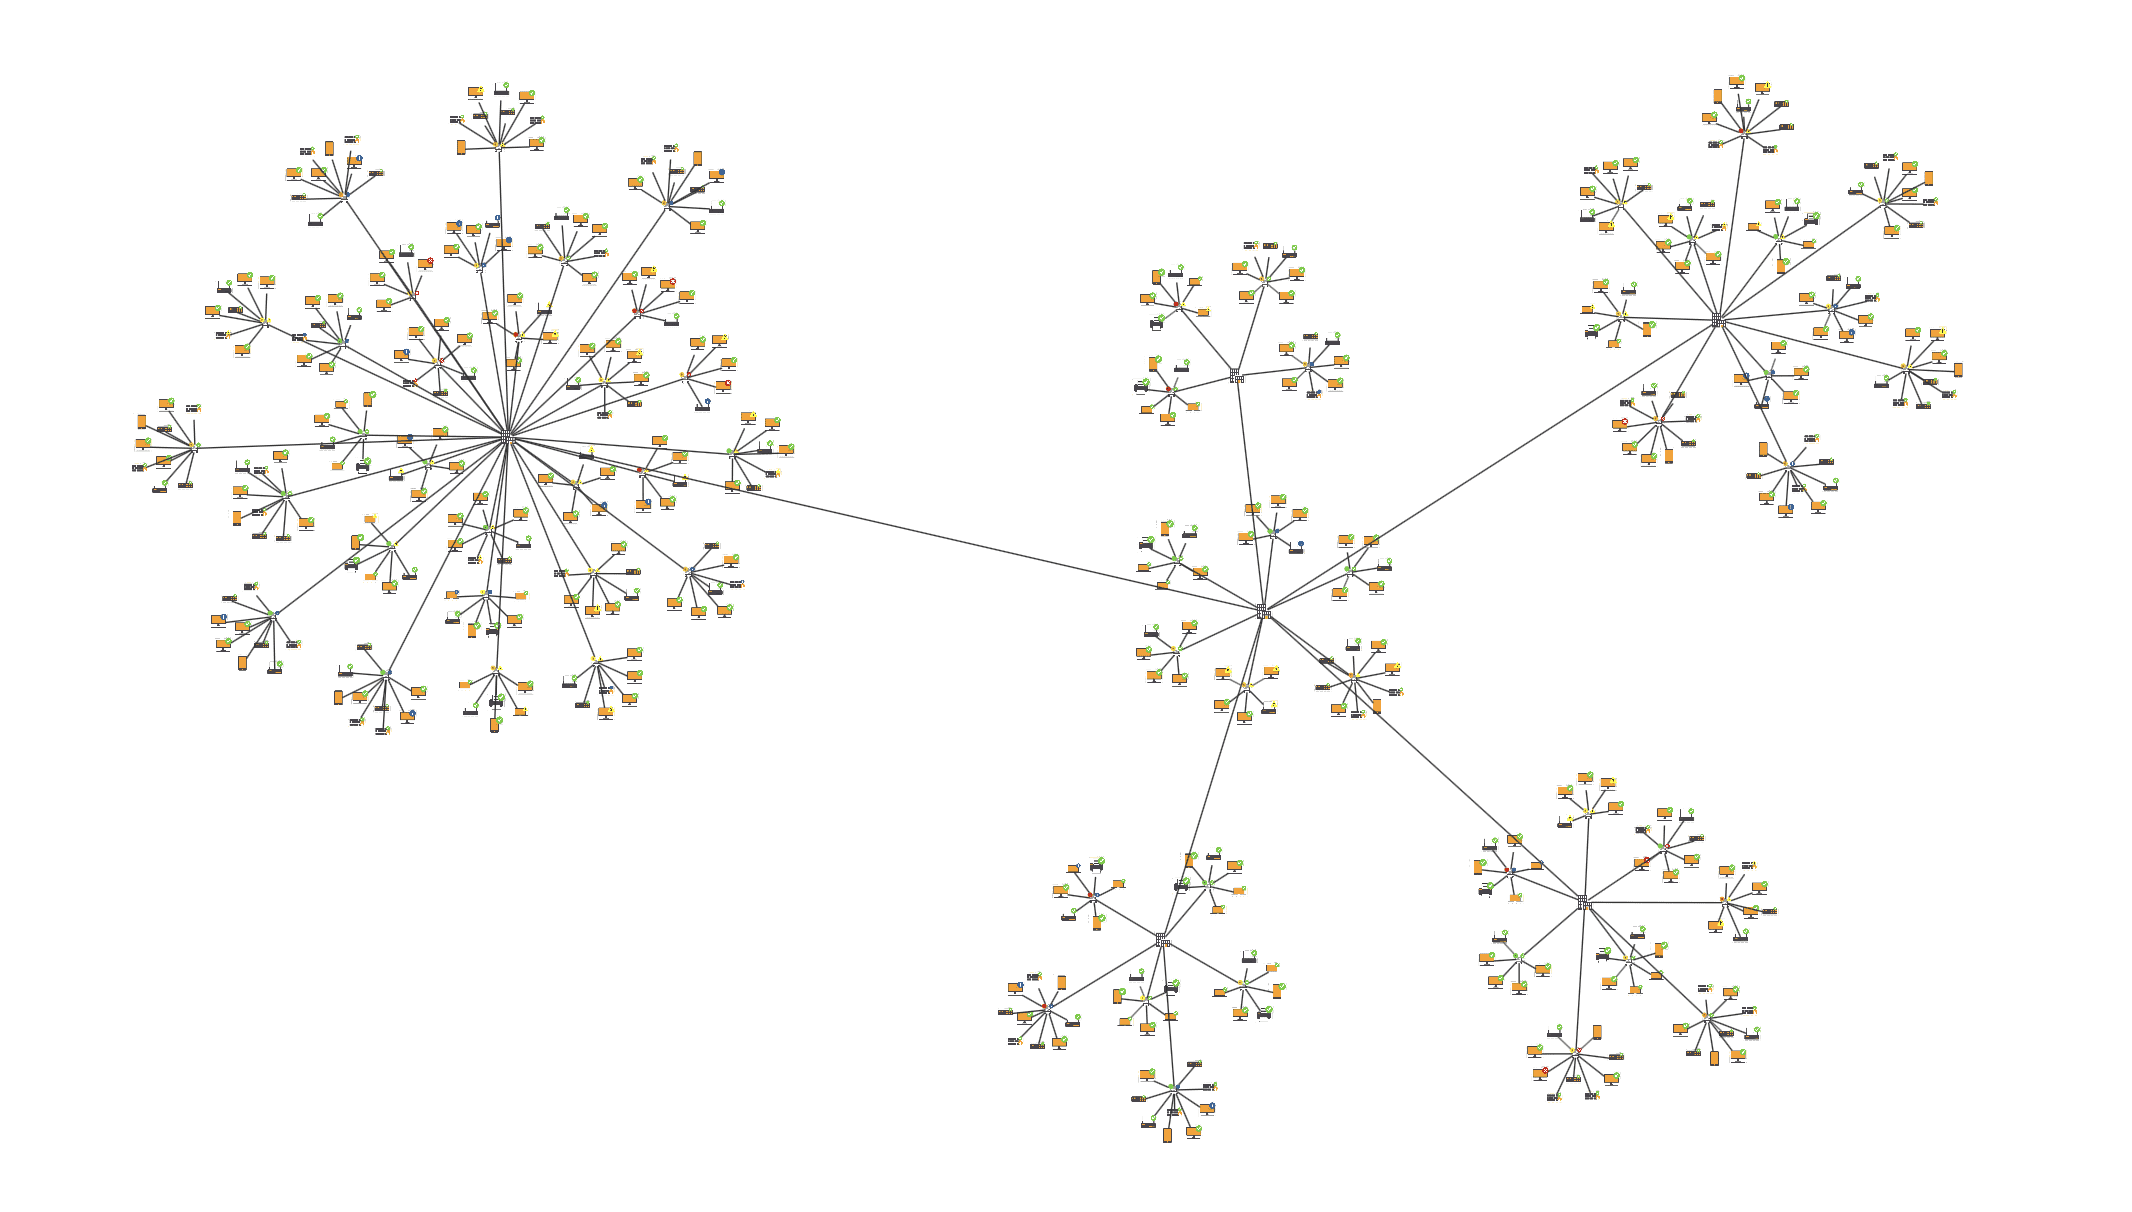
What is NetworkX Graph Visualization NetworkX graph visualization refers to the process of creating visual representations of complex networks using the NetworkX Python package. These...
Continue Reading
Introduction to Graph Visualization in .NET Graph visualization is essential for data analysis and presentation, allowing users to interpret complex relationships and structures through...
Continue Reading.png)
Breadth-First Search (BFS) is a key algorithm for exploring graphs—but understanding its behavior isn’t always straightforward from code alone. With graph visualization, we can see exactly...
Continue Reading
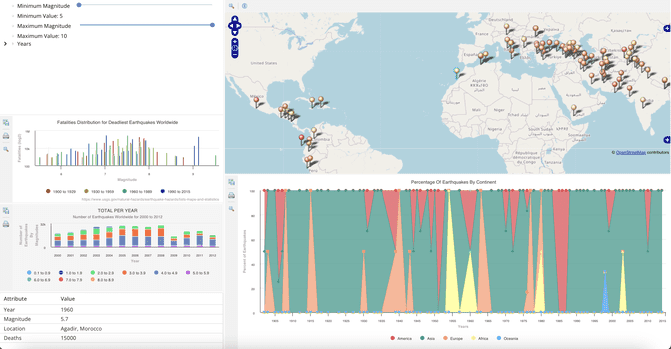
Presenting complex information visually is crucial. Whether you're working on a dashboard, analytics tool, or any data-heavy application, integrating graphs and charts can significantly...
Continue Reading
Understanding how entities relate and evolve over time and space is essential, especially in domains like smart cities, autonomous systems, cybersecurity, and industrial IoT. This is where...
Continue Reading
Submit a Comment