

Caroline Scharf
Vice President of Operations
Graph theory network analysis uses graph models and algorithms to examine a network's relationships and structure. The analysis begins by modeling entities and their connections: in a transportation network, locations become nodes and the routes between them become edges. Direction and edge attributes determine how those connections can be traversed and what the analysis can establish.
A route with the lowest travel time may still depend on a connection whose failure leaves a destination unreachable. Shortest-path analysis identifies the route according to the selected weights, while connectivity analysis examines what happens when that connection is removed. Visualizing the results within the network allows an analyst to inspect the affected locations and determine where alternative routes remain available.
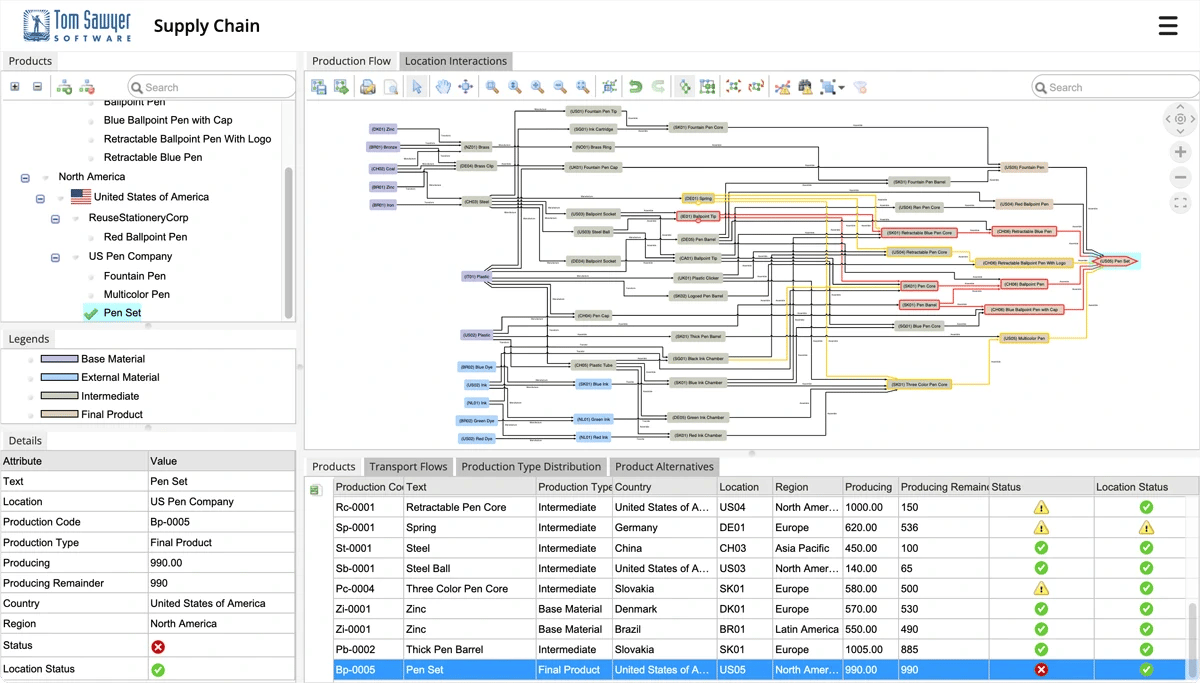
A complex supply chain that applies graph network analysis to highlight at-risk chains.
Core Principles of Graph Theory
A graph model defines the relationships available for analysis. Its structure must reflect the system being investigated, with enough detail to distinguish connections that have different meanings or operational consequences.
Modeling Network Relationships
Nodes, also called vertices, represent entities at the level of detail required by the analysis. In a computer network, a node might represent a router and an edge a communication link. A service-dependency model describes a different relationship: an edge can record that one service depends on another. Both models may describe the same infrastructure, yet support different investigations. Biological networks can similarly represent proteins as nodes and their interactions as edges.
Directed graphs assign a source and a target to each edge. If an edge from service A to service B means that A depends on B, it does not establish a dependency in the reverse direction. The convention must remain consistent throughout the model. An undirected edge records a connection without assigning a source or target, allowing paths to follow that connection in either direction.
Weighted graphs associate numerical values with edges. A weight describing relationship strength has a different meaning from a cost assigned to traversing an edge. When a weight represents travel time, a shortest-path calculation minimizes the total travel time along the route. Capacity describes a different property and must be interpreted according to the requirements of a flow calculation. In an unweighted graph, path length is commonly measured by the number of edges traversed.
Degree describes a node’s immediate connectivity. In a simple undirected graph, it is the number of edges incident to that node; directed graphs distinguish incoming edges from outgoing edges through in-degree and out-degree. An adjacency matrix records connections between pairs of vertices and can represent edge presence or weights. These properties belong to the graph model regardless of the layout used to display it.
Understanding Graph Connectivity
Paths describe how one vertex can be reached from another. A simple path contains no repeated vertices and, in a directed graph, follows the orientation of each edge. A simple cycle returns to its starting vertex without repeating any other vertex. In a dependency model, such a cycle identifies a circular chain of dependencies whose significance depends on the system’s rules.
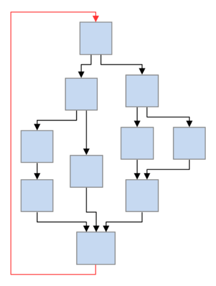
A simple graph showing cycle analysis algorithm applied to find cycles and circular dependencies in a graph.
A simple graph showing cycle analysis algorithm applied to find cycles and circular dependencies in a graph.
Connectivity concerns reachability across the network. A connected component in an undirected graph is a maximal group of vertices joined by paths. Directed graphs require a further distinction: weak connectivity disregards edge direction, while a strongly connected component is a maximal group in which every vertex can reach every other through directed paths. A communication route from A to B therefore establishes reachability in that direction; a return route must be assessed separately.
Graph Algorithms and Their Applications
An algorithm’s objective determines what its result establishes about a network. In graph theory network analysis, the meaning assigned to edge attributes is part of that objective: minimizing travel time requires a different calculation from maximizing flow under capacity constraints. Selecting appropriate graph analysis algorithms starts with defining the question the model needs to answer.
Finding Routes Through a Network
Path analysis can establish whether a destination is reachable or identify a route according to a defined criterion. In an unweighted graph, breadth-first search finds paths with the fewest edges from a starting vertex. When edges carry non-negative weights, Dijkstra’s algorithm finds paths with the lowest cumulative weight. The result represents the fastest route when those weights describe travel time.
The objective must remain explicit when several attributes describe the same connection. Selecting travel time as the weight does not also minimize operating cost or account for capacity. Those requirements need to be represented in the formulation before the resulting route can support an operational decision.
Interpreting Node Centrality
Centrality measures describe structural position according to different definitions of importance. Degree centrality reflects direct connectivity. A vertex with fewer direct connections may nevertheless occupy an important position between other parts of the network. Betweenness centrality examines this role through the share of shortest paths between other vertices that pass through it. Its interpretation therefore depends on whether shortest paths represent meaningful routes in the system being studied. A high score can guide investigation, but does not by itself establish influence or explain behavior.
Identifying Critical Connections
Bridge detection identifies edges whose removal increases the number of connected components in an undirected graph. Such an edge provides the only connection between the parts it joins. This is a specific test of structural vulnerability: an edge can carry many shortest paths without being a bridge if an alternative connection exists. In directed networks, the assessment must preserve direction, since a surviving connection may allow travel one way without providing a return route.
Network Flow Under Capacity Constraints
Network flow analysis examines how much can move through a system under specified constraints. Maximum flow determines the greatest feasible flow from a source to a sink. Each edge has a capacity, and intermediate vertices must satisfy flow conservation: the total incoming flow equals the total outgoing flow. The result concerns the modeled network’s feasible throughput rather than the travel time of an individual route.
Minimum-cost flow introduces the cost of moving flow while satisfying defined requirements and capacity limits. This allows an analysis to account for the expense of distributing resources across available connections. Its formulation requires compatible units and an explicit description of the supply and demand being modeled.
Minimum Spanning Trees in Network Design
A minimum spanning tree connects every vertex in a connected, weighted, undirected graph while minimizing the total weight of the selected edges. Prim’s and Kruskal’s algorithms solve this problem. In a telecommunications network, weights can represent the installation costs of candidate links. A minimum spanning tree then identifies the lowest-cost set of those links that connects all modeled locations.
The resulting tree contains no cycles, so removing any of its edges disconnects it. Network designs that require continued access after a failure need additional connections or other resilience provisions. The minimum spanning tree provides a cost-based structure for evaluation; operational requirements determine whether that structure is sufficient.
Network Analysis in Action
Social Network Analysis
A social network model is defined by the relationship being investigated. In an organizational communication network, edges might record messages between employees during a specified period. A collaboration network would represent a different relationship, even if it included the same people. The distinction affects how the resulting structure should be interpreted.
An organization investigating communication between departments can examine connections that cross its formal reporting boundaries. Centrality analysis can help identify people who occupy intermediary positions, while clustering can reveal groups with concentrated internal interaction. These findings provide a basis for examining how work is coordinated and where communication depends on a limited set of relationships.
The observation period matters. A network assembled during a major project may reflect temporary coordination rather than established working relationships. Comparisons between departments or periods therefore need a consistent definition of the interactions included in the model.
Transportation Network Analysis
Transportation networks connect locations through routes with operational restrictions. A road network may require directed edges to represent one-way travel, with weights describing the time needed to traverse each segment. Shortest-path analysis can then identify a minimum-time route within those conditions. Vehicle restrictions and delivery windows introduce constraints beyond a basic shortest-path calculation.
Connectivity analysis supports a different decision: assessing which locations lose access when a connection becomes unavailable. A facility may have several nearby roads yet depend on one crossing to reach the wider network. Examining that crossing within the complete topology can expose a vulnerability that its geographic surroundings alone do not reveal.
For freight distribution, continued access is only part of the assessment. The remaining routes may lack sufficient capacity to meet demand after a disruption. Network flow analysis can evaluate feasible throughput under the modeled capacities, helping distinguish a network that remains connected from one that can sustain the required movement of goods.
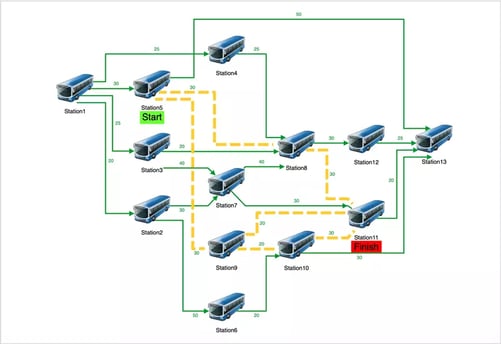
A transportation network illustrating network flow analysis in Tom Sawyer Perspectives.
Computer Network Analysis
Computer network analysis uses graph models to examine the connections between devices and the routes available for communication. The model must preserve the direction of links where transmission is asymmetric. Link attributes can record latency and capacity, allowing the analysis to address routing and throughput as separate questions.
A route calculated from latency measurements describes the conditions represented by those measurements. If congestion changes substantially, the selected route may no longer provide the lowest delay. An application using changing network data therefore needs a defined approach to updating attributes and recalculating affected results.
Failure analysis examines the topology that remains after a device or link becomes unavailable. An alternative path may preserve reachability while concentrating traffic on connections with limited capacity. Reviewing connectivity alongside flow constraints gives network planners a basis for assessing the consequences of a failure.
Physical connectivity also differs from service availability. A device can remain reachable while an application depending on a failed service becomes unavailable. Investigating that situation requires a dependency model that captures the relevant service relationships; a physical topology graph alone does not contain enough information to establish the application impact.
Analyzing a Microwave Network with Tom Sawyer Perspectives
Tom Sawyer Software’s Microwave Network example demonstrates the application of graph analysis to a microwave transmission network. Built using Tom Sawyer Perspectives, the application combines analysis with a visual representation of the connections between devices and antennas.
The visualization uses edge color to represent load and edge thickness to represent capacity. These attributes give the connections operational context: users can examine the network’s structure while inspecting the characteristics of its links. Node colors distinguish locations, adding another reference for interpreting the drawing.
Shortest Path analysis identifies the fastest communication routes in the modeled network. The route calculation and the visual representation of load and capacity provide different information. Examining them together allows users to consider a route within the surrounding network and inspect the link attributes relevant to their investigation.
Graph Analysis in Tom Sawyer Perspectives
Tom Sawyer Perspectives is a low-code platform for developing custom graph visualization and analysis applications. Its graphical Designer provides an environment for configuring an application, and the Previewer supports examining and refining that work before deployment. Developers can use the platform’s APIs for custom application development or incorporate its visualization capabilities into an existing application.
The platform’s data federation and integration capabilities bring connected data into an in-memory graph model while allowing existing source systems to remain in place. This provides a graph representation for analysis without requiring the source data to originate in a graph database. The application’s model determines how entities and relationships are represented for the investigation.
Users can apply integrated graph analysis algorithms to a graph or selected subgraph without writing code. The scope of the calculation is part of the investigation: examining a selected portion of a network can answer a more focused question than analyzing the larger graph. Tom Sawyer Perspectives supports interactive execution as well as automated background processing, allowing analysis to be incorporated into the application’s workflow.
Clustering analysis identifies areas of higher connectivity within the graph. Partitioning separates the graph into components that can be examined individually, helping users investigate how the network is organized. In dependency models, cycle analysis identifies circular dependencies that may need examination before further analysis.
A supply chain model can connect components to the products that depend on them, allowing analysts to examine which dependencies may be affected by a shortage. In fraud investigations, path analysis can help trace connections between accounts and transactions that warrant closer examination.

Graph analysis techniques included with Tom Sawyer Perspectives.
Automatic graph layout organizes the drawing so users can follow the relationships relevant to their analysis. Hierarchical layout is suited to models in which edge direction matters, such as dependency graphs. As a drawing changes, incremental layout minimizes disruption to existing positions, helping users maintain their orientation while inspecting the network.
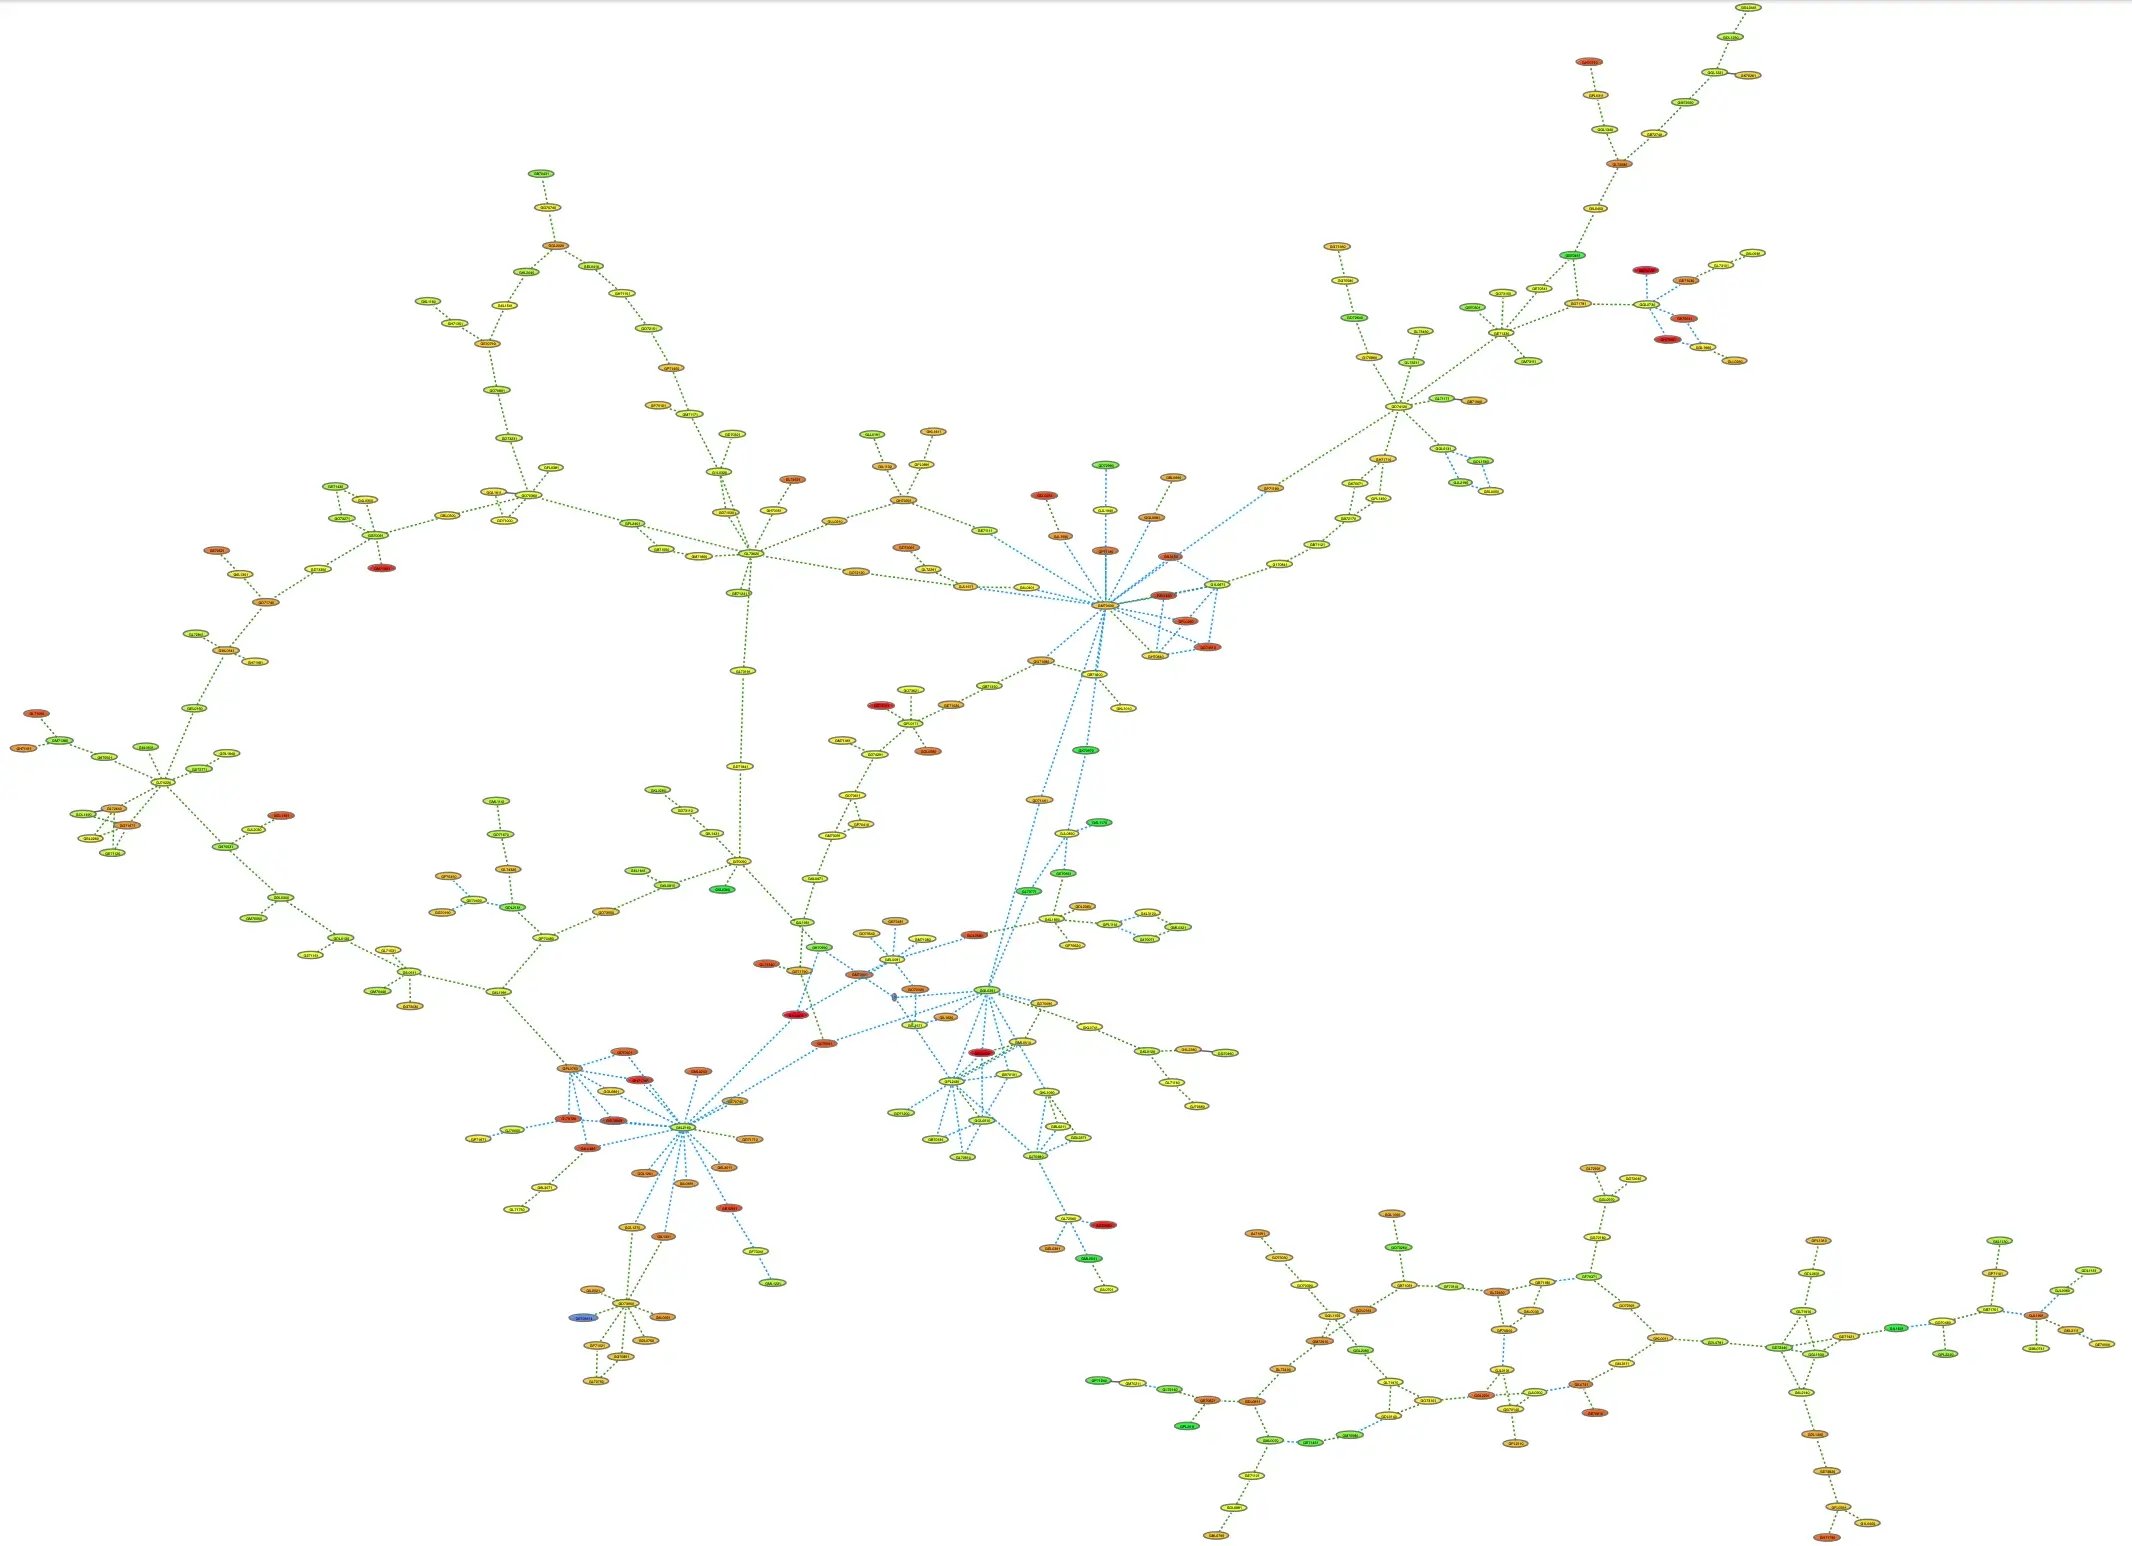
A large network graph visualized with Tom Sawyer Perspectives.
Data Quality and Computational Limits
Assessing the Reliability of Graph Data
A graph analysis result describes the relationships represented in the model. Missing connections can make a network appear more fragmented than it is or make an edge appear to be a bridge when an unrecorded alternative exists. The calculation may be correct for the available graph while providing an incomplete account of the system.
Entity identification affects the structure before any algorithm runs. Inconsistent identifiers can split one entity across several nodes, changing its apparent connectivity. Combining distinct entities can create relationships that do not exist in the underlying system. Resolving these inconsistencies is necessary before interpreting structural importance.
The scope of the calculation also matters. Analysis performed on a selected subgraph describes that selection. An edge may be a bridge within the selected portion while belonging to a cycle in the larger graph. The application should make that scope clear so users can distinguish a local finding from a conclusion about the complete network.
Computational Demands in Changing Networks
The workload depends on the analytical task as well as the number of nodes and edges. Finding a route between two locations differs from calculating paths across many pairs of locations. Performance evaluation therefore needs to reflect the operations users will perform and the amount of data each operation examines.
Changes to the model can also affect previously calculated results. An updated edge weight may alter a shortest path, while a new connection may change reachability. The application’s update workflow should define when affected analysis results are refreshed. The timing of those calculations should be assessed separately from updates to the drawing.
Response time should be assessed across the application workflow. A calculation can finish quickly while data retrieval or drawing updates delay the result users see. Evaluating these stages separately helps identify where delays arise and supports decisions about the appropriate scope and frequency of analysis.
Working with Sensitive Network Data
A network model can expose sensitive relationships even when individual records contain little identifying information. Connections between people, accounts, or organizations may reveal associations that require careful handling. The investigation should define which information is needed and who should have access to the graph and its analysis results.
Differences in data collection also affect interpretation. A person whose interactions are recorded consistently may appear more connected than someone whose activity is only partially captured. Before structural measures inform decisions about individuals, analysts need to examine whether those differences reflect actual relationships or uneven observation.
About the Author
Caroline Scharf, VP of Operations at Tom Sawyer Software, has more than 25 years leadership experience at large and small software companies. She has a passion for process and policy in streamlining operations, a solution-oriented approach to problem solving, and is a strong advocate of continuous evaluation and improvement.
FAQs About Graph Theory Network Analysis
What Data Is Needed for Graph Theory Network Analysis?
The analysis requires identifiable entities and records of the relationships between them. Consistent identifiers ensure that connections are assigned to the intended nodes. Additional attributes depend on the question being investigated. Finding a minimum-time route requires travel-time values, while evaluating throughput requires capacity information. The model must also preserve direction when a relationship operates from one entity to another.
How Do I Choose a Graph Algorithm for Network Analysis?
Choose an algorithm whose objective and assumptions match the question the analysis must answer. Confirm that its requirements are compatible with the graph model and the meaning of its edge attributes. Testing a small case with a known result helps verify that the calculation is configured correctly. Evaluation with representative data then establishes whether its computational demands suit the application.
Does High Centrality Always Mean Greater Influence?
A high centrality score describes a node’s structural position according to a particular measure. It does not establish real-world influence by itself. Different measures can rank the same nodes differently because they examine different aspects of connectivity. Interpreting a score requires an understanding of the relationships represented and the extent to which the data captures the network being investigated.
Submit a Comment