
CAD data integration in digital engineering is the process of connecting CAD-derived geometry and metadata to a system representation that preserves meaning, relationships, and intent...
Continue Reading
CAD data integration in digital engineering is the process of connecting CAD-derived geometry and metadata to a system representation that preserves meaning, relationships, and intent...
Continue Reading
Digital twins in manufacturing refer to continuously executing orchestration platforms within manufacturing environments that enable real-time coordination, system-level reasoning, and...
Continue Reading
Digital twins promise real-time awareness, predictive insight, and closed-loop control, but none of these outcomes are possible without a continuous stream of accurate, well-structured, and...
Continue Reading
Digital twin technology is rapidly becoming a foundational layer in enterprise systems engineering. As organizations move toward more interconnected, software-defined, and data-driven...
Continue Reading
Graphs provide a structured way to represent relationships between entities. They are widely used to model complex systems, such as software architectures, data pipelines, social networks,...
Continue Reading
In fields where relationships shape outcomes, such as cybersecurity, finance, logistics, and bioinformatics, understanding how everything connects is key to gaining meaningful insights....
Continue Reading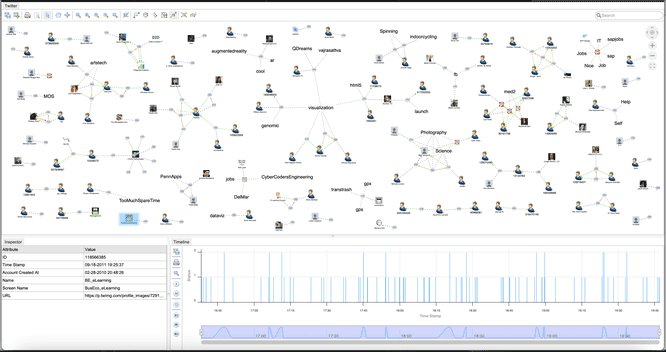
Graph visualization is a critical tool for understanding relationships in complex data. This article examines how Golang handles graph representation and contrasts it with modern UI...
Continue Reading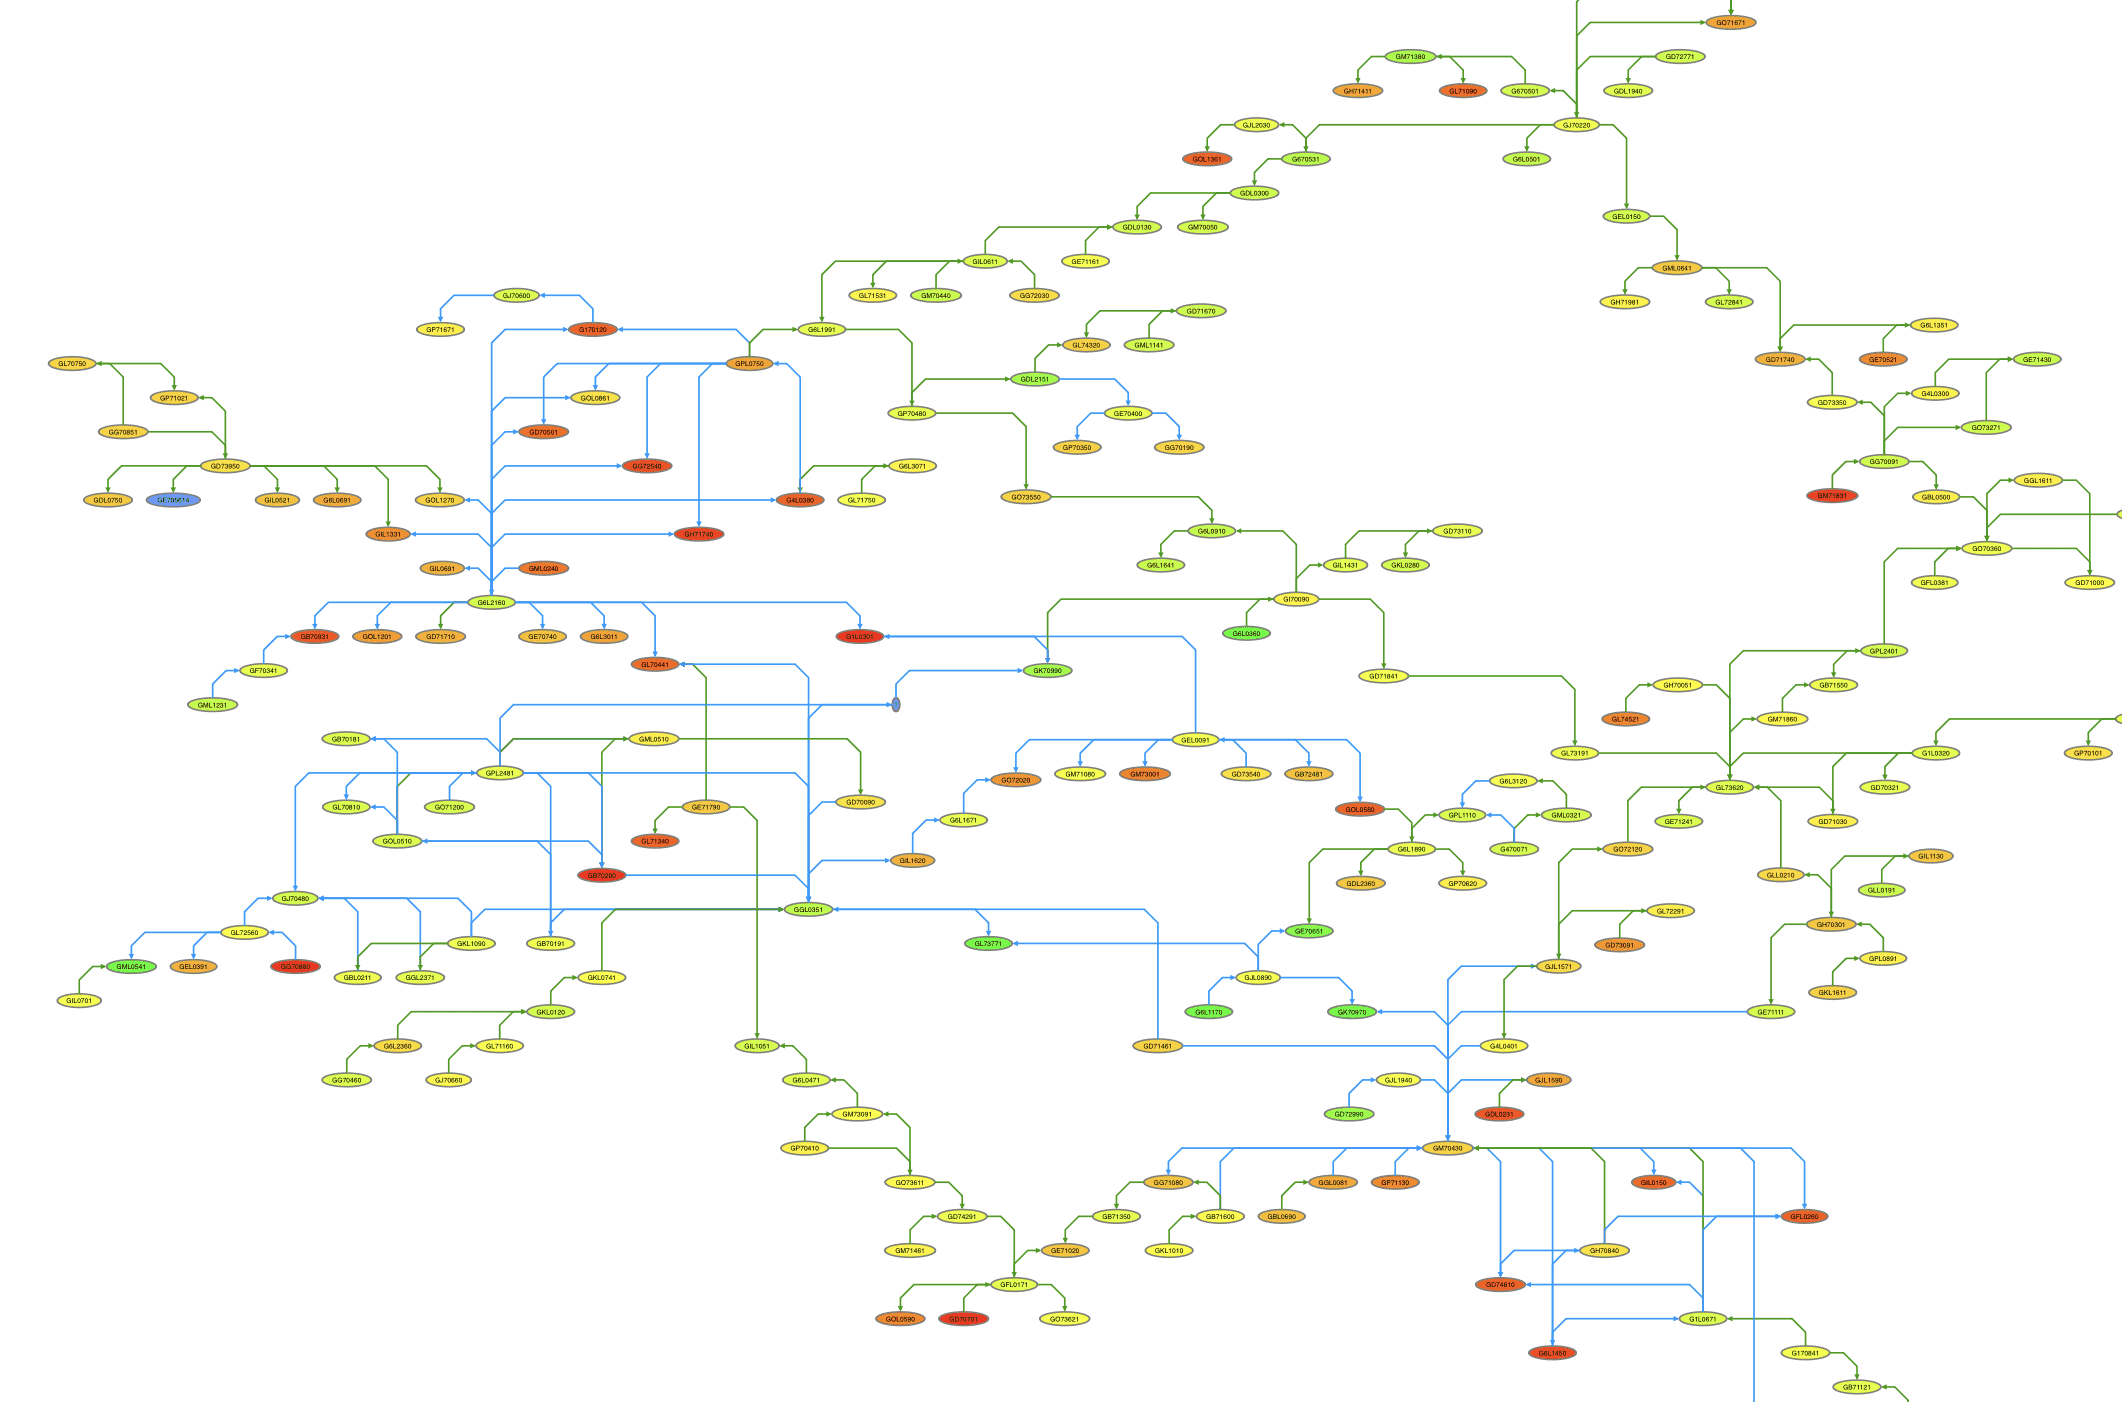
The growth of biological data in genomics and proteomics has introduced both opportunity and complexity. Researchers increasingly rely on structured vocabularies—ontologies—to describe gene...
Continue Reading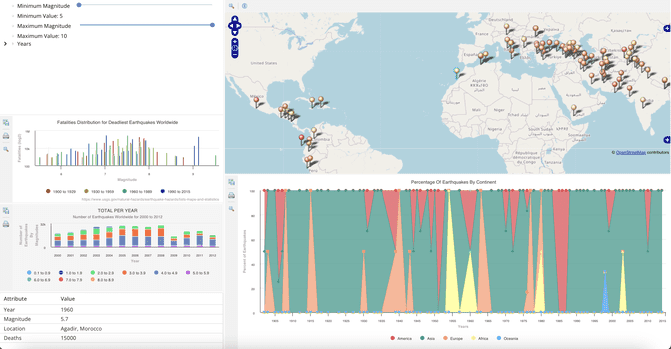
Grafana’s graph visualization capabilities are frequently used by organizations that need quick visibility into system metrics and performance trends. While the platform supports a range of...
Continue Reading
Submit a Comment