Digital twin technology is rapidly becoming a foundational layer in enterprise systems engineering. As organizations move toward more interconnected, software-defined, and data-driven...
Continue Reading
Digital twin technology is rapidly becoming a foundational layer in enterprise systems engineering. As organizations move toward more interconnected, software-defined, and data-driven...
Continue Reading
Understanding the distinctions between structured data systems, such as databases, knowledge bases, and knowledge graphs, is essential for anyone working with information in engineering,...
Continue Reading
What Is Cosmos DB Graph Visualization? Cosmos DB graph visualization refers to the process of representing graph data stored in Azure Cosmos DB in a visual and interactive format. Unlike...
Continue Reading
Graph visualization is widely used to understand and analyze complex systems where the relationships between entities are more important than the entities themselves. By translating...
Continue Reading
Graphs provide a structured way to represent relationships between entities. They are widely used to model complex systems, such as software architectures, data pipelines, social networks,...
Continue Reading
Graph visualization SDKs are built for one purpose: to help developers create interactive views of connected data. Instead of assembling custom rendering logic, layout engines, and...
Continue Reading
In fields where relationships shape outcomes, such as cybersecurity, finance, logistics, and bioinformatics, understanding how everything connects is key to gaining meaningful insights....
Continue Reading
Graph data is embedded in the core of many modern systems — from cybersecurity and financial risk analysis to logistics and academic research. As datasets become larger and more...
Continue Reading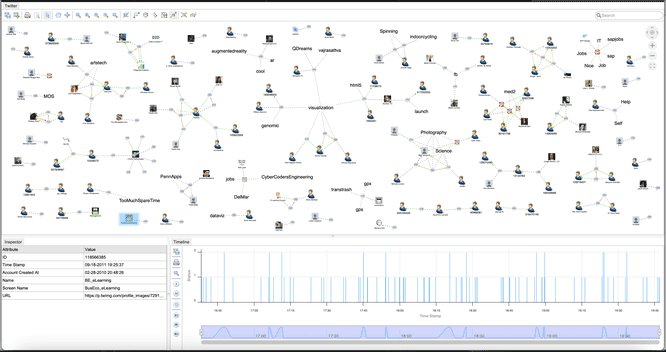
Graph visualization is a critical tool for understanding relationships in complex data. This article examines how Golang handles graph representation and contrasts it with modern UI...
Continue Reading
Submit a Comment