Graph visualization is widely used to understand and analyze complex systems where the relationships between entities are more important than the entities themselves. By translating...
Continue Reading
Graph visualization is widely used to understand and analyze complex systems where the relationships between entities are more important than the entities themselves. By translating...
Continue Reading
Graphs provide a structured way to represent relationships between entities. They are widely used to model complex systems, such as software architectures, data pipelines, social networks,...
Continue Reading
Graph visualization SDKs are built for one purpose: to help developers create interactive views of connected data. Instead of assembling custom rendering logic, layout engines, and...
Continue Reading
In fields where relationships shape outcomes, such as cybersecurity, finance, logistics, and bioinformatics, understanding how everything connects is key to gaining meaningful insights....
Continue Reading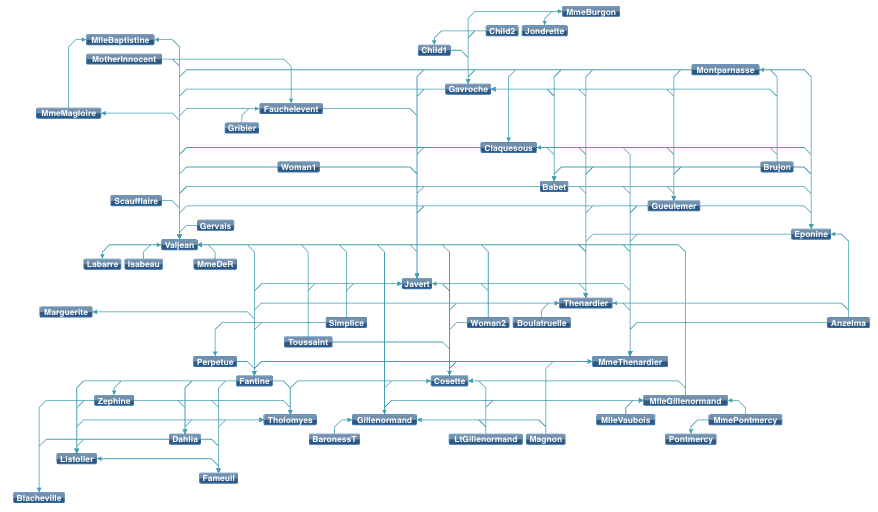
Graph data is embedded in the core of many modern systems — from cybersecurity and financial risk analysis to logistics and academic research. As datasets become larger and more...
Continue Reading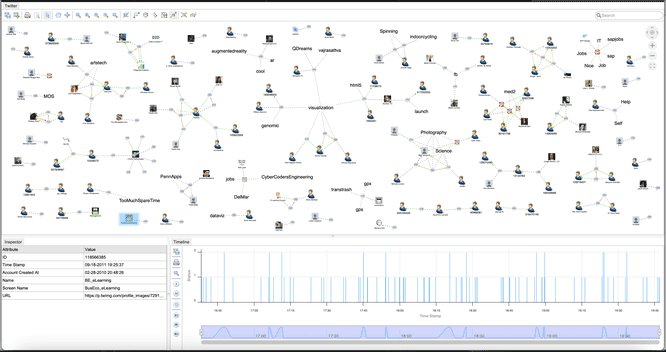
Graph visualization is a critical tool for understanding relationships in complex data. This article examines how Golang handles graph representation and contrasts it with modern UI...
Continue Reading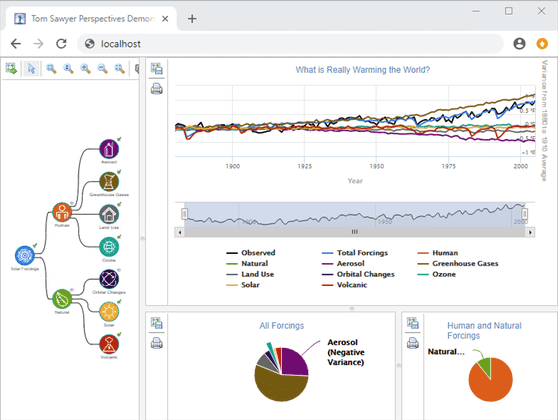
Line graphs are a foundational method for visualizing how data changes over time. They help surface trends, highlight anomalies, and provide structure to otherwise fragmented time series....
Continue Reading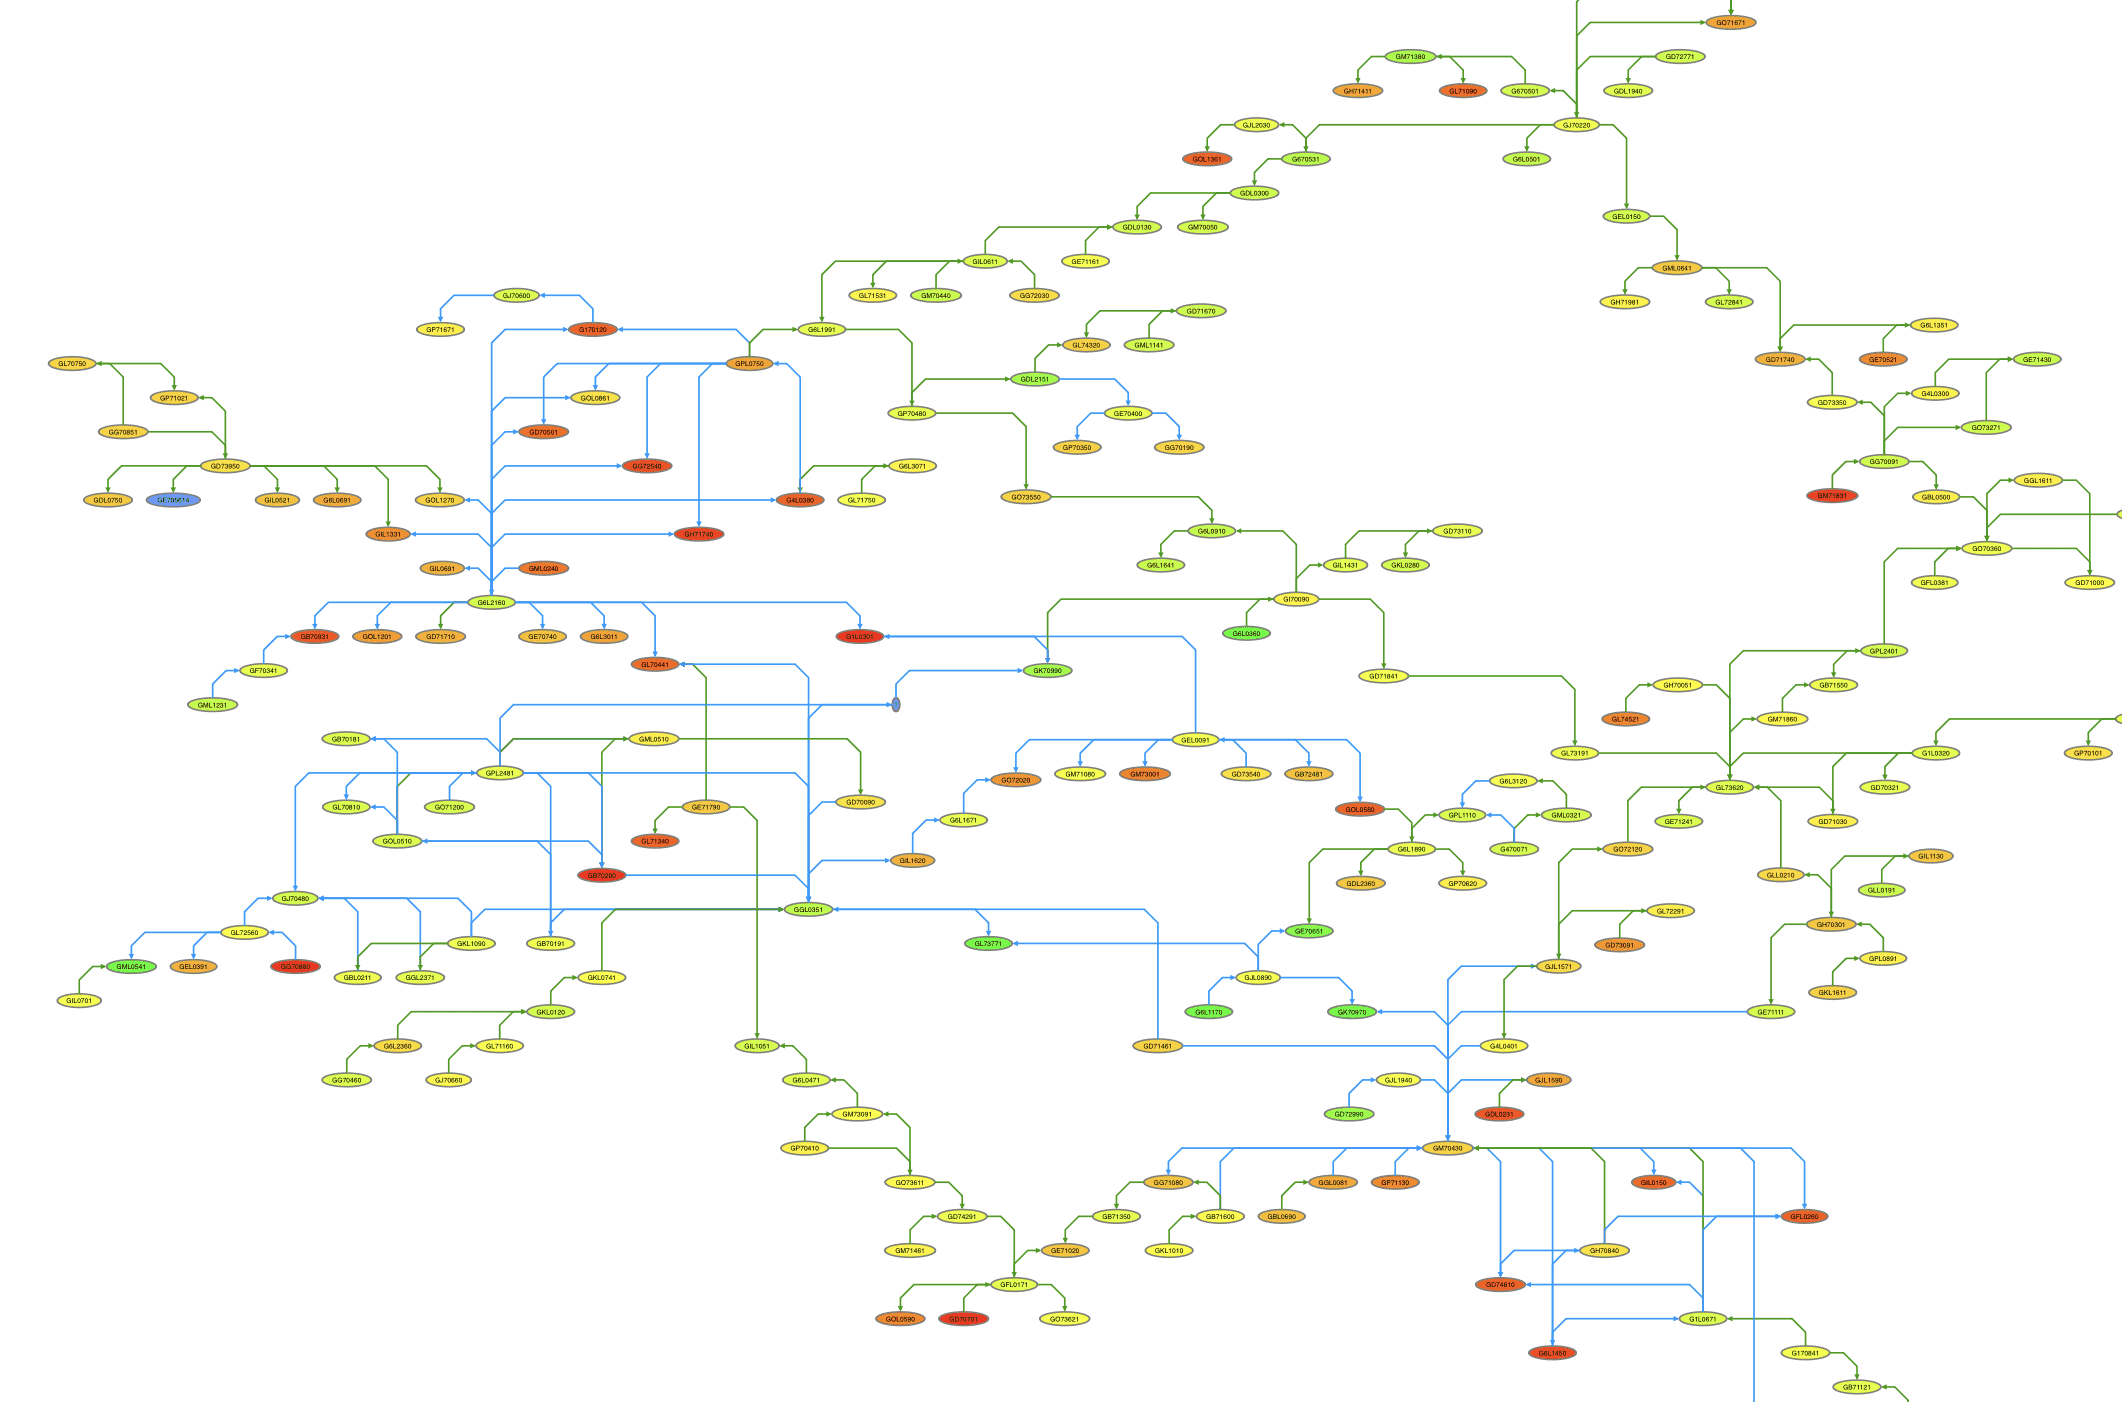
The growth of biological data in genomics and proteomics has introduced both opportunity and complexity. Researchers increasingly rely on structured vocabularies—ontologies—to describe gene...
Continue Reading
Node.js is no longer just for APIs and microservices—it now powers full data visualization stacks. This article explains how Node.js data visualization works across backend workflows,...
Continue Reading
Submit a Comment