
Caroline Scharf
Vice President of Operations
Understanding complex relationships within interconnected datasets is a crucial skill. Graph visualization offers a sophisticated approach to representing data, using nodes to signify entities and edges to highlight relationships. This methodology enables organizations, researchers, and developers to uncover patterns, identify trends, and solve problems that would otherwise remain hidden in raw, unstructured data.
This guide is designed to offer a comprehensive exploration of GitHub graph visualization. Covering foundational concepts, essential tools, and advanced techniques, it provides actionable insights for both beginners and experienced practitioners. Whether you’re visualizing branching in a repository with git graph visualization or leveraging Janus graph visualization for large-scale datasets, this guide equips you with the knowledge to navigate the complexities of modern data visualization effectively.
Understanding Graphs and Their Applications
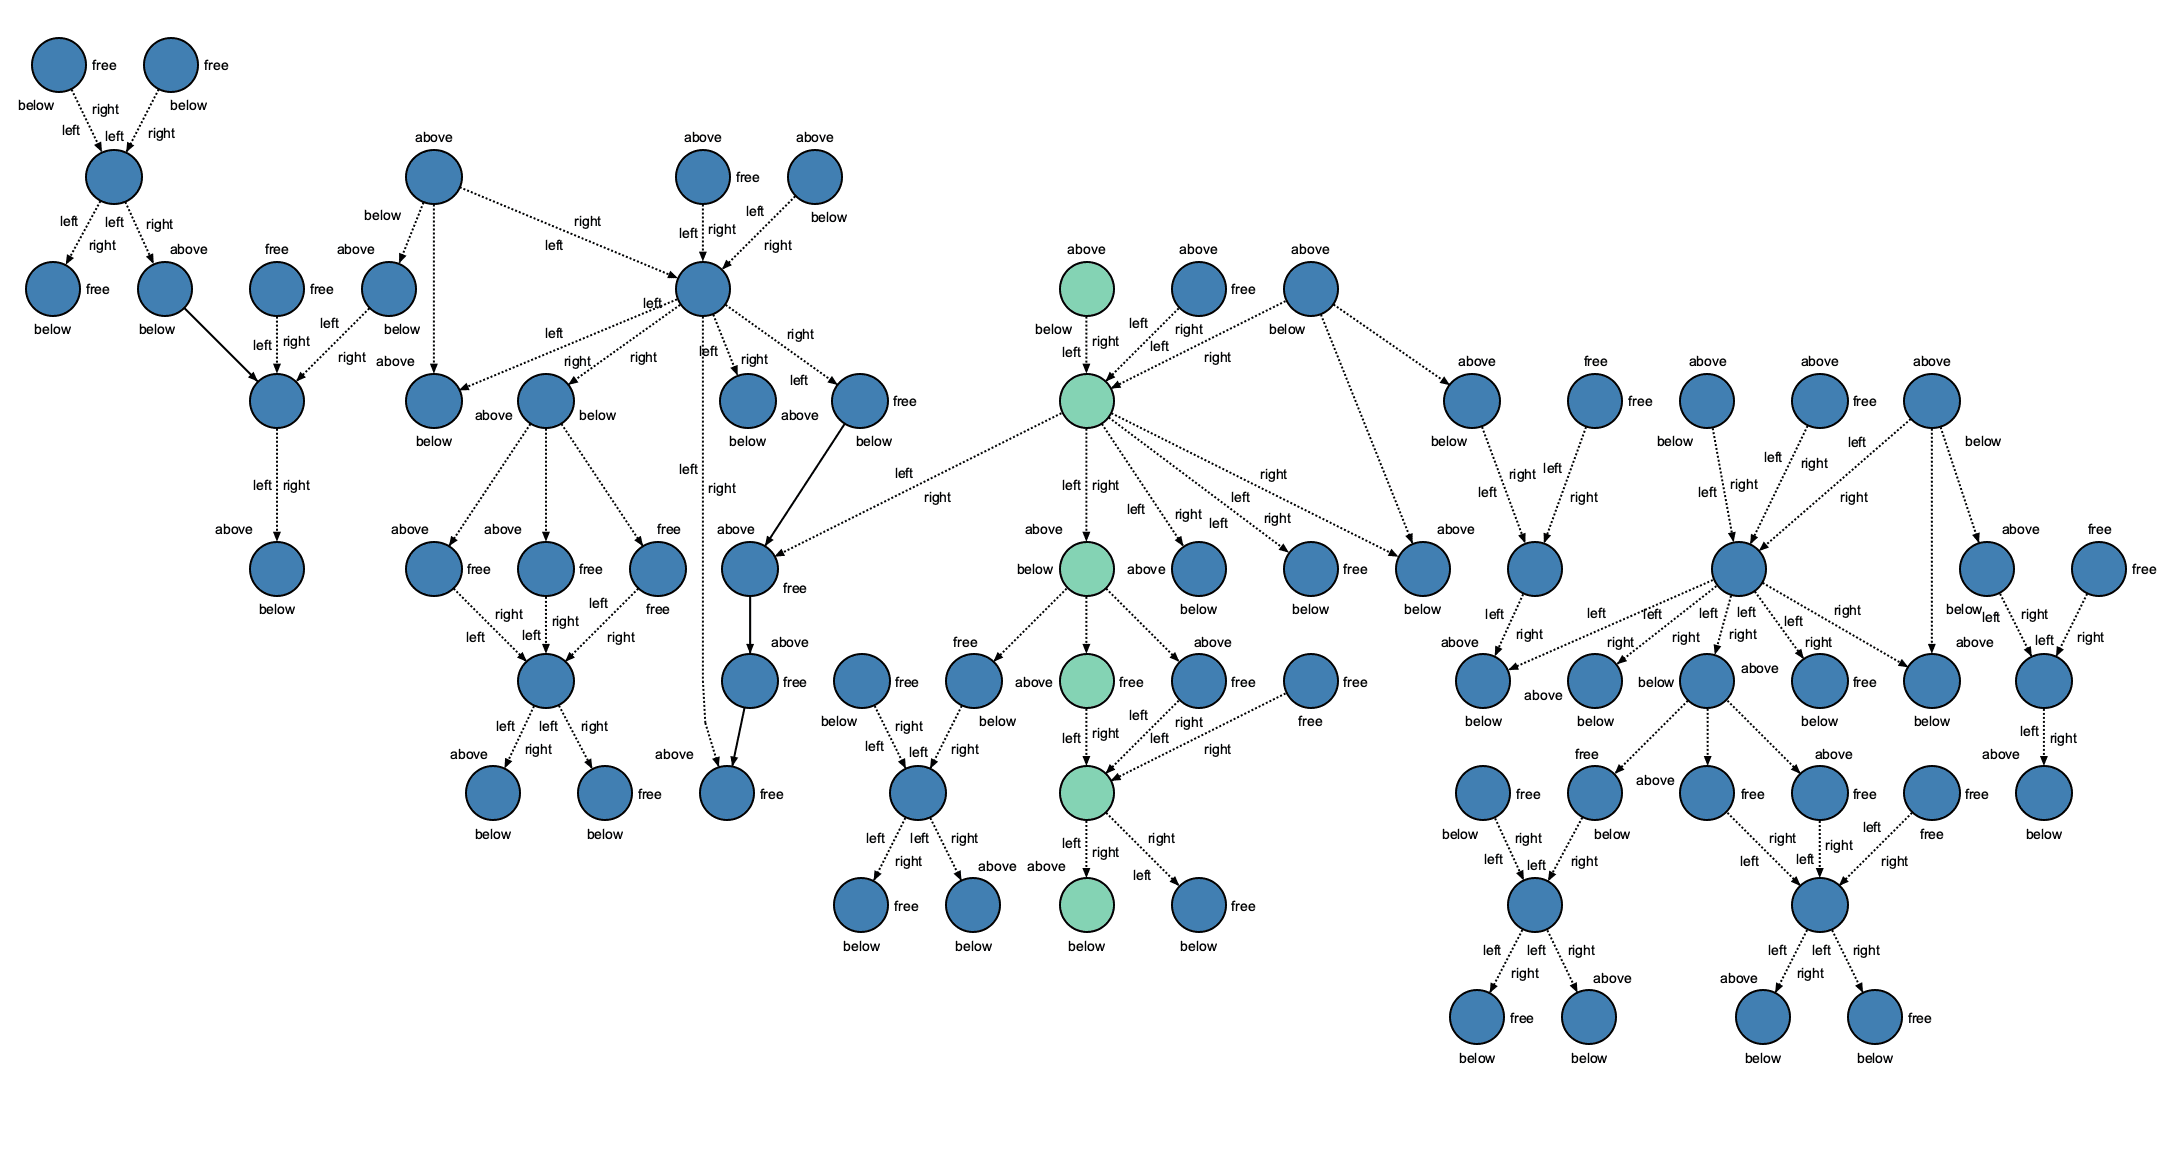
A graph of vertical constraints organized hierarchically.
Graphs are a fundamental way to represent data and its relationships. At their core, graphs consist of nodes (also called vertices) and edges. Nodes represent entities, such as users, files, or data points, while edges capture their relationships or interactions. For example, in a Git repository, nodes can represent commits, and edges might show how different branches connect or diverge.
Edges can be directed, showing one-way relationships, or undirected, indicating mutual connections. In more advanced scenarios, graphs may also use weighted edges, where the connections carry values to represent strength, frequency, or capacity. These weighted relationships are particularly useful in fields like network traffic analysis or recommendation systems.
Graph visualization is especially valuable for practical applications. For instance, visualizing a GitHub repository using tools like git graph visualization can provide clarity on how branches and commits interact over time. This approach is indispensable for understanding project contributions and spotting potential inefficiencies in branching strategies. Similarly, analyzing code dependencies through graphs helps identify critical modules in large codebases, making it easier to optimize project architecture.
Tools for GitHub Graph Visualization
A variety of tools are available to help users create and explore GitHub graph visualizations. Choosing the right tool depends on the size and complexity of your project and your technical expertise. Below, we explore some of the most popular options and their key features.
One of the most widely used tools is Graphviz, which is known for its simplicity and efficiency in creating quick, straightforward visualizations. It is ideal for smaller projects or generating a clear and concise graph without much customization. With Graphviz, you can represent branches, commits, and relationships in Git repositories, making it a reliable choice for basic git graph visualizations.
For more interactive and visually appealing graphs, D3.js offers unparalleled customization. This JavaScript library allows you to build web-based visualizations that are dynamic and interactive. Developers often use D3.js to create GitHub graph visualizations that not only represent data but also allow users to explore it in real-time.
When working with large-scale networks, Gephi is a powerful open-source tool that excels at analyzing and visualizing large datasets. It is frequently used in social network analysis, dependency mapping, and organizational graph exploration. Its robust functionality makes it a popular choice for advanced GitHub graph visualization tasks.
Another valuable tool is Cytoscape, which provides a user-friendly interface for network data analysis. Originally designed for biological research, Cytoscape has been adopted by developers and data scientists for general graph visualization tasks. Its compatibility with various data formats and straightforward setup make it an excellent choice for visualizing GitHub repositories.
For enterprise-grade projects, Tom Sawyer Perspectives and JanusGraph stand out. Tom Sawyer Perspectives specializes in advanced visualization and layout algorithms, making it ideal for visualizing complex software architectures or organizational networks hosted on GitHub. Meanwhile, JanusGraph, a scalable graph database, is perfect for handling massive datasets. It is particularly well-suited for scenarios where querying and analyzing large interconnected datasets—such as those used in Janus graph visualization—are crucial.
Each of these tools offers unique strengths, so understanding your project’s requirements will help you select the most suitable option. Whether you’re visualizing commits with git graph visualization or modeling extensive knowledge graphs with JanusGraph, the right tool can transform your data into actionable insights.

A detailed graph showing different sub-processes.
How to Create and Host GitHub Graph Visualizations
Creating and hosting GitHub graph visualizations involves several steps, from preparing your data to sharing your visualizations with others. Below is a streamlined process to help you get started and make the most out of graph visualization tools.
Organizing Your Data
Before diving into visualization, it’s crucial to organize your data. Most graph visualization tools work with formats like JSON, CSV, or adjacency matrices. In a GitHub repository, you can structure your data to represent commits as nodes and branching relationships as edges. Ensure your data is clean and well-structured, as this will directly impact the clarity of your graph.
Selecting the Right Tool
Choosing the right tool depends on your project’s complexity and objectives. For smaller repositories, tools like Graphviz are excellent for generating straightforward git graph visualizations. If you require interactive or web-based visualizations, D3.js is a versatile choice. For larger datasets, consider using Gephi or JanusGraph for advanced analysis and visualization.
Generating the Graph
Once your data is ready, import it into your chosen tool. For example:
- In Graphviz, use the DOT language to define nodes and edges, then render the graph.
- With D3.js, write JavaScript code to bind your data to visual elements and apply layouts for dynamic visualization.
- In JanusGraph, load your data into the graph database and use its built-in query tools to explore relationships.
For projects involving GitHub repositories, tools like git graph visualization plugins can automatically generate visualizations of branches, commits, and merges, saving time and effort.
Hosting Your Visualization on GitHub
After creating your visualization, the next step is to host it on GitHub for sharing and collaboration. One popular approach is to use GitHub Pages, a feature that allows you to deploy static web pages directly from your repository.
Alternatively, if you’re using tools like Jupyter Notebooks, you can embed static visualizations or integrate interactive outputs directly within your notebooks. By sharing these notebooks on GitHub, you provide collaborators with a clear and reproducible way to understand and build upon your work.
Collaborating and Iterating
GitHub’s version control features make it easy to collaborate on graph visualizations. Teams can contribute to changes, suggest improvements, or review existing visualizations. Tools like GitHub Actions further enhance this process by automating tasks, such as regenerating graphs when new data is added.
By following these steps, you can create, host, and share GitHub graph visualizations that effectively communicate insights and foster collaboration across teams.
Advanced Techniques and Customization
For developers and organizations looking to take their GitHub graph visualizations to the next level, advanced techniques and customization options offer significant benefits. These approaches enhance the clarity, performance, and interactivity of visualizations, making them more effective for analyzing complex data.
Optimizing Graphs for Clarity and Performance
When dealing with large or intricate graphs, optimization is essential to ensure they remain understandable and actionable. One common strategy is simplifying complex graphs by filtering out less relevant nodes or edges. For example, in a git graph visualization, you might focus on active branches and recent commits rather than displaying the entire history of the repository.
Another crucial aspect is ensuring performance. Large datasets, such as those handled with Janus graph visualization, can become computationally intensive. Using techniques like hierarchical layouts or clustering nodes can significantly improve rendering speed and readability. Tools like Gephi and Tom Sawyer Perspectives provide built-in options for these optimizations.

An example graph showing the use of clustering nodes.
Customizing Graph Visualizations
Customization allows you to tailor your graph visualizations to better suit your project’s needs or your audience’s preferences. With tools like D3.js, you can create highly interactive and visually appealing graphs by integrating animations, hover effects, and tooltips.
Tom Sawyer Perspectives features like nested drawings, advanced node and edge labeling, precise shape clipping, port and connectors controls, and incremental layout to see the superstructure of your data and produce visually clear graphs that are understood by domain experts and stakeholders alike.
Styling your graphs with custom themes and layouts is another way to enhance their impact. Using JavaScript libraries or CSS, you can control colors, fonts, and node shapes to align with your branding or highlight critical elements.
Automating Graph Updates
For projects that frequently evolve, automation is a game-changer. Using GitHub Actions, you can automate tasks such as updating graphs whenever new commits are pushed or when dependency data changes. This ensures that your visualizations always reflect the most up-to-date information without requiring manual intervention.
Integrating Graphs with Other Tools
Combining graph visualization tools with analytics platforms or machine learning models can unlock deeper insights. For instance, integrating JanusGraph with AI tools can help detect patterns or anomalies within interconnected data. Developers working on GitHub repositories might use this setup to analyze contributor activity or predict potential bottlenecks in development workflows.
Exploring these advanced techniques and customization options, you can elevate your GitHub graph visualizations into powerful tools for data exploration and decision-making.
Best Practices for Effective GitHub Graph Visualization
Creating effective GitHub graph visualizations requires more than just technical skills—it involves thoughtful design and careful consideration of the audience's needs.
Focus on Simplicity and Clarity
Graphs should simplify complex information, not overwhelm the viewer. Avoid adding unnecessary nodes or edges that can clutter the visualization. When creating a git graph visualization, prioritize displaying active branches and key commits instead of including the entire repository history. Use clear labels and meaningful node shapes to help users quickly grasp the graph’s structure.
Balance Detail and Readability
While it’s tempting to include as much information as possible, overloading a graph can make it difficult to interpret. Strike a balance by using hierarchical layouts, clustering similar nodes, or filtering data to highlight the most relevant elements. Tools like Gephi and D3.js provide built-in features for clustering and simplifying complex datasets.
Make Use of Color and Visual Hierarchy
Colors are a powerful tool for highlighting key elements in a graph. Contrasting colors help distinguish between node types or edge relationships. In Janus graph visualization, distinct colors represent different data categories, such as users, transactions, or products, making relationships easier to interpret.
Ensure Accessibility
Consider accessibility for diverse audiences by following best practices like ensuring colorblind-friendly palettes, providing descriptive labels, and avoiding overly small text or symbols. This makes your GitHub graph visualizations more inclusive and easier to use for a broader audience.
Iterate and Improve
Visualizations are rarely perfect on the first try. Gather feedback from your team or audience to identify areas for improvement. Tools like GitHub’s collaboration features make it easy to share visualizations and incorporate suggestions. Automation through GitHub Actions can streamline updates and improvements over time for dynamic projects.
Avoid Common Pitfalls
There are a few mistakes that can undermine the effectiveness of your graph visualizations:
- Overloading graphs with too much data: Focus on the most relevant insights.
- Neglecting interactivity: Interactive features like zooming or tooltips can significantly enhance user experience.
- Ignoring performance issues: Large graphs can become slow to render, optimize layouts and limit excessive details.
Real-World Examples and Use Cases
The power of GitHub graph visualization lies in its versatility across a wide range of applications. Here are some real-world examples that showcase how graph visualization can solve practical challenges and provide valuable insights.
Mapping Open-Source Contribution Networks
In large open-source projects hosted on GitHub, understanding the network of contributors can be challenging. Using git graph visualization, you can map relationships between contributors, commits, and branches. This type of graph helps project maintainers identify key contributors, monitor collaboration patterns, and spot inactive branches that might need pruning. Tools like Gephi can create visualizations that show clusters of contributors working on specific parts of the codebase, providing a clear view of project dynamics.
Visualizing Code Dependencies
Complex software systems often rely on a web of interconnected modules and files. Graph visualizations can reveal these dependencies, helping developers optimize their architecture. A GitHub graph visualization can highlight critical bottlenecks, circular dependencies, or unused modules by representing files as nodes and dependencies as edges. This insight is invaluable for streamlining codebases and improving overall performance.
Exploring Social and Organizational Networks
For enterprises managing large datasets, tools like Janus graph visualization are ideal for uncovering patterns in social or organizational networks. A graph might map relationships between employees, teams, and projects, revealing hidden connections and opportunities for collaboration. In a GitHub context, this approach can be used to analyze how different teams contribute to shared repositories, ensuring better alignment and resource allocation.
Analyzing Knowledge Graphs
Knowledge graphs are increasingly used to model relationships between entities in diverse domains, from e-commerce to healthcare. With tools like JanusGraph, users can construct and query massive knowledge graphs hosted on GitHub. An online retailer might use a knowledge graph to model product recommendations, connecting users, purchases, and product categories in a single interactive visualization.
These real-world applications highlight the versatility of GitHub graph visualization tools. Whether you’re managing a software project, analyzing dependencies, or exploring large datasets, graph visualizations provide actionable insights and help you make data-driven decisions.
Conclusion
Graph visualization is a transformative tool for understanding complex data relationships. By representing nodes and edges visually, it enables developers and organizations to identify patterns, uncover insights, and make data-driven decisions more effectively. Whether you’re analyzing repository contributions, exploring code dependencies, or mapping large-scale networks, GitHub graph visualization offers unparalleled flexibility and functionality.
Throughout this guide, we’ve explored the core concepts of graph visualization, practical tools like Graphviz, D3.js, and JanusGraph, and real-world applications for git graph visualization and Janus graph visualization. Each tool and technique discussed equips you with the knowledge to confidently approach visualization projects, regardless of their complexity.
The power of GitHub graph visualization lies not only in the insights it provides but also in its ability to foster collaboration. By leveraging GitHub’s features for hosting, sharing, and automating graph updates, teams can work more efficiently and stay aligned, even in the most dynamic projects.
As you move forward, consider experimenting with the tools and techniques discussed in this guide. Start with simple visualizations to build your confidence, then explore advanced features like interactivity, automation, and large-scale graph databases. The combination of practical knowledge and innovative tools will enable you to create visualizations that not only communicate effectively but also drive meaningful action.
About The Author
Caroline Scharf, VP of Operations at Tom Sawyer Software, has 15 years experience with Tom Sawyer Software in the graph visualization and analysis space, and more than 25 years leadership experience at large and small software companies. She has a passion for process and policy in streamlining operations, a solution-oriented approach to problem solving, and is a strong advocate of continuous evaluation and improvement.
FAQ
What Is The Difference Between Graph Visualization And Graph Databases?
Graph visualization and graph databases serve distinct purposes, although they both center on representing relationships through nodes and edges.
Graph visualization primarily focuses on visual representations of graph data to make relationships and patterns easier to understand. It is used to identify trends, analyze structures, and communicate insights effectively. Tools like Gephi, D3.js, and Cytoscape are often employed to allow users to visually explore and interpret data.
Graph databases, on the other hand, are specialized storage systems designed to manage and query graph-structured data efficiently. They are optimized for handling large-scale, complex relationships and support powerful querying languages like Cypher (used by Neo4j). Graph databases enable users to store, retrieve, and analyze relationships in datasets, making them ideal for applications like recommendation systems, fraud detection, and social network analysis.
While graph visualization is about presenting and interpreting data, graph databases focus on storing and querying that data. These two approaches are often combined—data is managed in a graph database and visualized with visualization tools for deeper analysis.
How Can I Use GitHub Actions To Automate Graph Updates?
GitHub Actions can be configured to automatically update graph visualizations whenever changes are made to a repository. For instance, you can create a workflow that triggers every push or pull request, processes updated data, and regenerates the graph. By integrating scripts or tools like Graphviz, you can automate graph creation and even deploy updated visualizations to GitHub Pages. This ensures your visualizations remain current without requiring manual updates.
Can I Integrate GitHub Graph Visualizations With Cloud Platforms Like AWS Or Azure?
Yes, GitHub graph visualizations can be integrated with cloud platforms like AWS and Azure for enhanced scalability and processing power. You can use AWS Lambda or Azure Functions to process large datasets and generate visualizations dynamically. Storing data in AWS S3 or Azure Blob Storage allows you to host and serve visualizations globally. Additionally, integrating with graph databases like Amazon Neptune or Azure Cosmos DB enables advanced querying and visualization for massive datasets.
Which Data Formats Are Most Compatible With Graph Visualization Tools?
Graph visualization tools typically work with formats like JSON, CSV, and GraphML. JSON is highly flexible and often used with libraries like D3.js for dynamic visualizations. CSV files are simple and widely supported by tools like Gephi, making them ideal for smaller datasets. GraphML is specifically designed for graph data and is compatible with tools like Cytoscape and Gephi. For Graphviz, the DOT language is commonly used to define nodes and edges in a structured way.
What Are The Limitations Of GitHub Graph Visualization Tools?
GitHub graph visualization tools have some limitations, particularly when dealing with large datasets. Scalability can be a challenge, as tools like Graphviz may struggle with extensive graphs containing thousands of nodes and edges. Performance issues, such as slow rendering or lag, may arise when using browser-based visualizations like D3.js for interactive projects. Additionally, some tools require advanced technical knowledge, which can create a learning curve for users unfamiliar with coding or data preparation.
What Are The Best Practices For Visualizing Hierarchical Data On GitHub?
Visualizing hierarchical data effectively requires the use of appropriate layouts and clear representations. Tree layouts are ideal for hierarchical structures like directory trees or project dependencies, as they emphasize parent-child relationships. Tools like Graphviz and D3.js support tree layouts and allow customization to enhance readability. To improve clarity, consider using colors or labels to differentiate between levels of the hierarchy and avoid overcrowding the graph by focusing on key elements.
How Do I Combine Multiple Graph Visualization Tools In A Single Project?
Combining graph visualization tools can maximize the strengths of each. For example, you might use Gephi to analyze and preprocess large datasets, cleaning and structuring the data into meaningful clusters. Once prepared, the graph can be exported in a format like JSON or CSV and imported into D3.js to create an interactive, web-based visualization. This approach leverages Gephi’s analytical capabilities and D3.js’s flexibility for creating polished, interactive outputs.
Submit a Comment