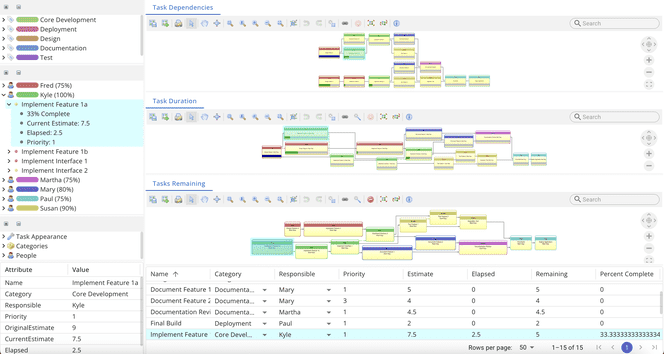
What Is Dependency Graph Visualization? Dependency graph visualization represents the relationships between various components in a system using graphical diagrams. These graphs provide a...
Continue Reading
What Is Dependency Graph Visualization? Dependency graph visualization represents the relationships between various components in a system using graphical diagrams. These graphs provide a...
Continue ReadingDot Graph Visualization is a method for illustrating complex systems using the DOT language—a lightweight, plain-text format purpose-built for graph descriptions.
Continue Reading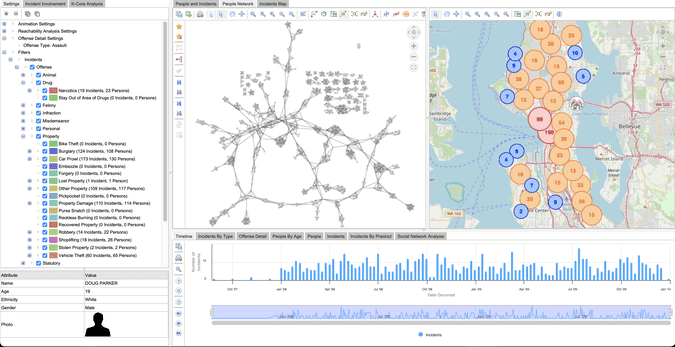
Presenting complex information visually is crucial. Whether you're working on a dashboard, analytics tool, or any data-heavy application, integrating graphs and charts can significantly...
Continue Reading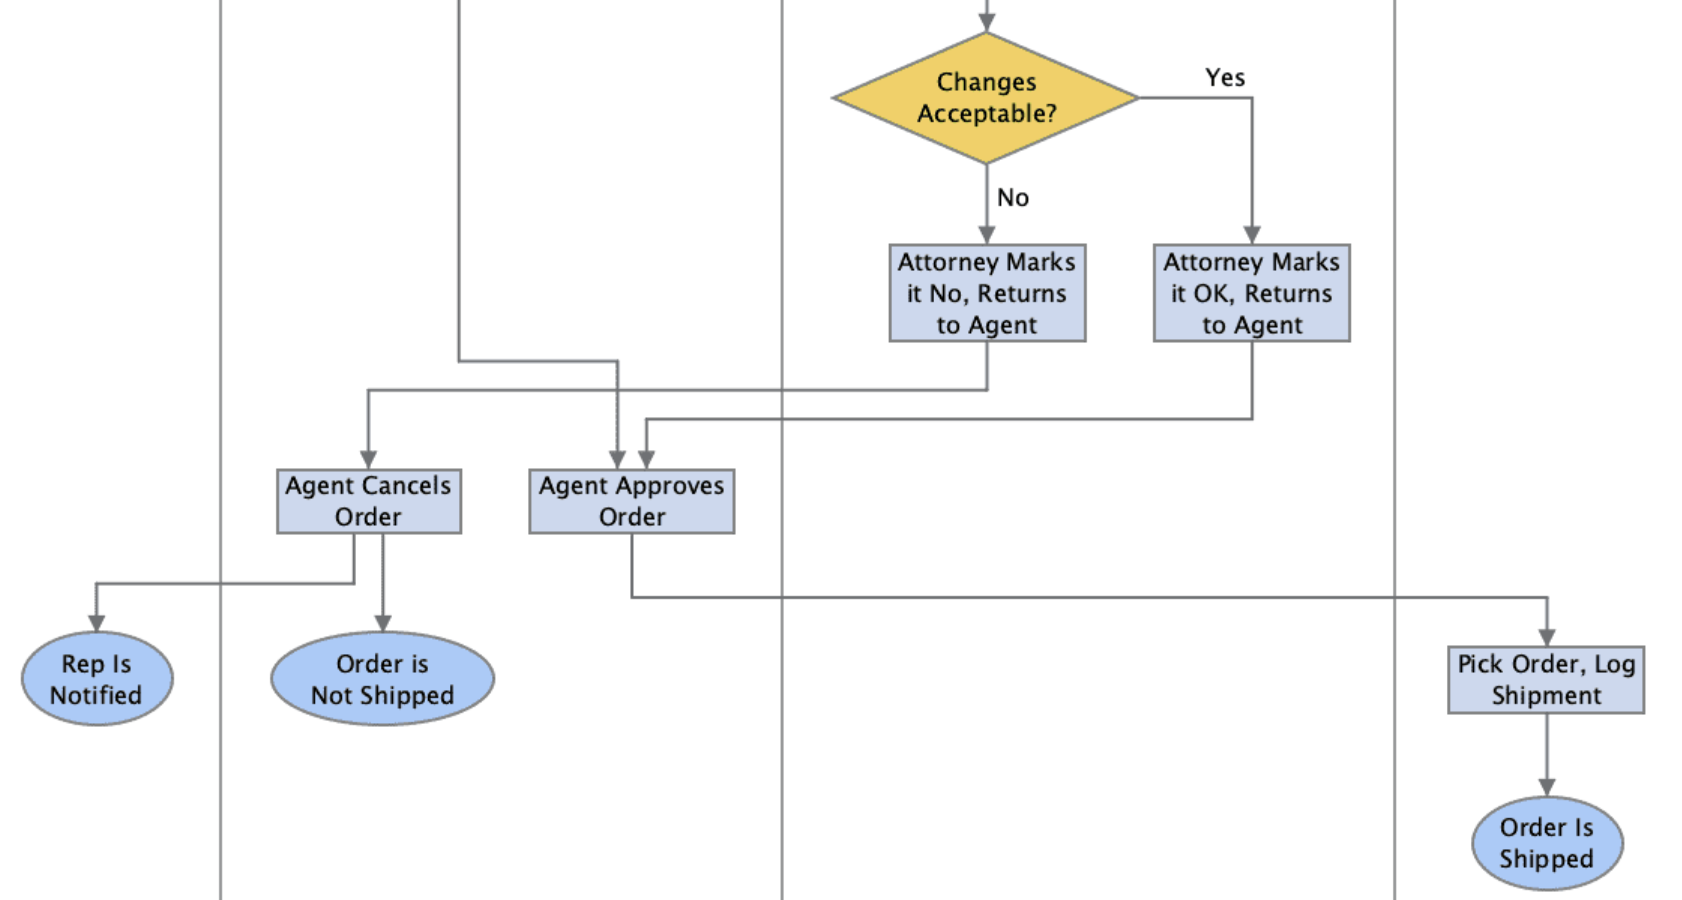
When it comes to graph visualization, most developers instinctively reach for tools in Python or JavaScript. But if you're working in Julia—a language known for its high-performance...
Continue Reading
Graph visualization is an essential part of data analysis when working with complex relationships—such as social networks, recommendation engines, cybersecurity maps, and biological...
Continue Reading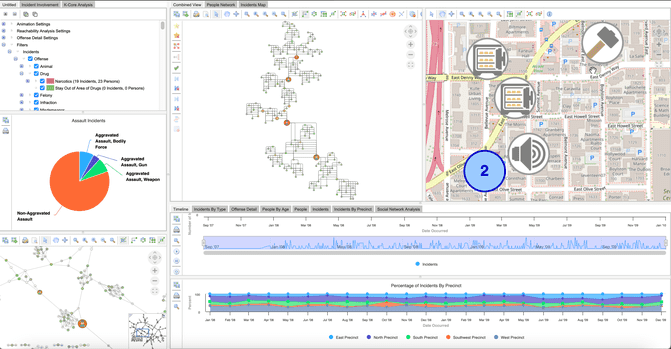
What Are Data Visualization Libraries? Data visualization libraries are specialized software tools that help transform raw data into visual representations such as charts, graphs, and...
Continue Reading
Angular is one of the leading front-end frameworks that provide excellent tools and libraries for creating sophisticated graph visualizations. Angular graph visualization transforms...
Continue Reading
Jupyter Notebook Graph Visualization provides a powerful and interactive way to analyze and visualize complex relationships in data using Python. By leveraging graph structures composed of...
Continue Reading
Submit a Comment