
Caroline Scharf
Vice President of Operations
Financial graph analysis offers a visual representation of financial data that aids investors, analysts, and economists in making informed decisions. This article delves into the multifaceted realm of financial graphs, highlighting their critical role in market analysis, the core concepts and terminology essential for understanding them, and the various types of financial graphs utilized across the industry.
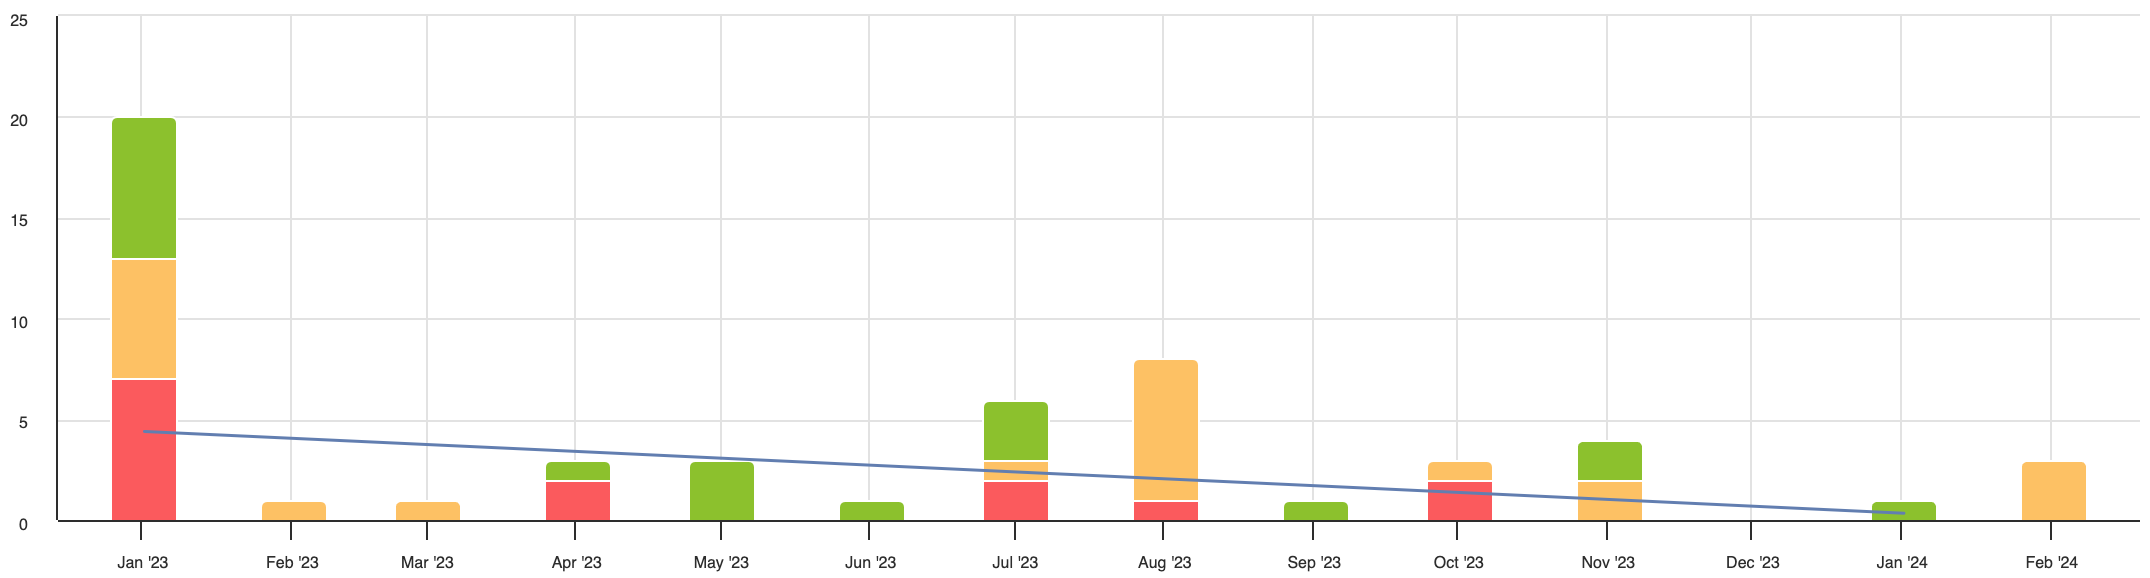
A financial graph bar chart showing trends over time.
Introduction to Financial Graph Analysis
Financial Graph Analysis is an essential tool in the financial sector, offering a visual representation of financial data over time. This technique is key for analysts, investors, and traders to interpret market trends, assess stock performance, and make informed investment decisions. It encompasses various graph types, each tailored to display specific financial information, such as price movements, volume traded, and market sentiment.
Understanding these graphs enables the identification of patterns, prediction of future movements, and derivation of insights from complex data sets, facilitating strategic planning and risk management in financial endeavors.
The Importance of Financial Graphs in Market Analysis
Financial graphs are invaluable in market analysis, serving as a bridge between raw data and actionable insights. They condense complex information into visual formats that highlight trends, patterns, and anomalies, enabling analysts to make informed decisions quickly. By illustrating how different variables interact over time, financial graphs facilitate a deeper understanding of market dynamics.
They are crucial for identifying investment opportunities, assessing risk, and formulating strategies that align with market movements, thereby playing a pivotal role in optimizing financial performance.
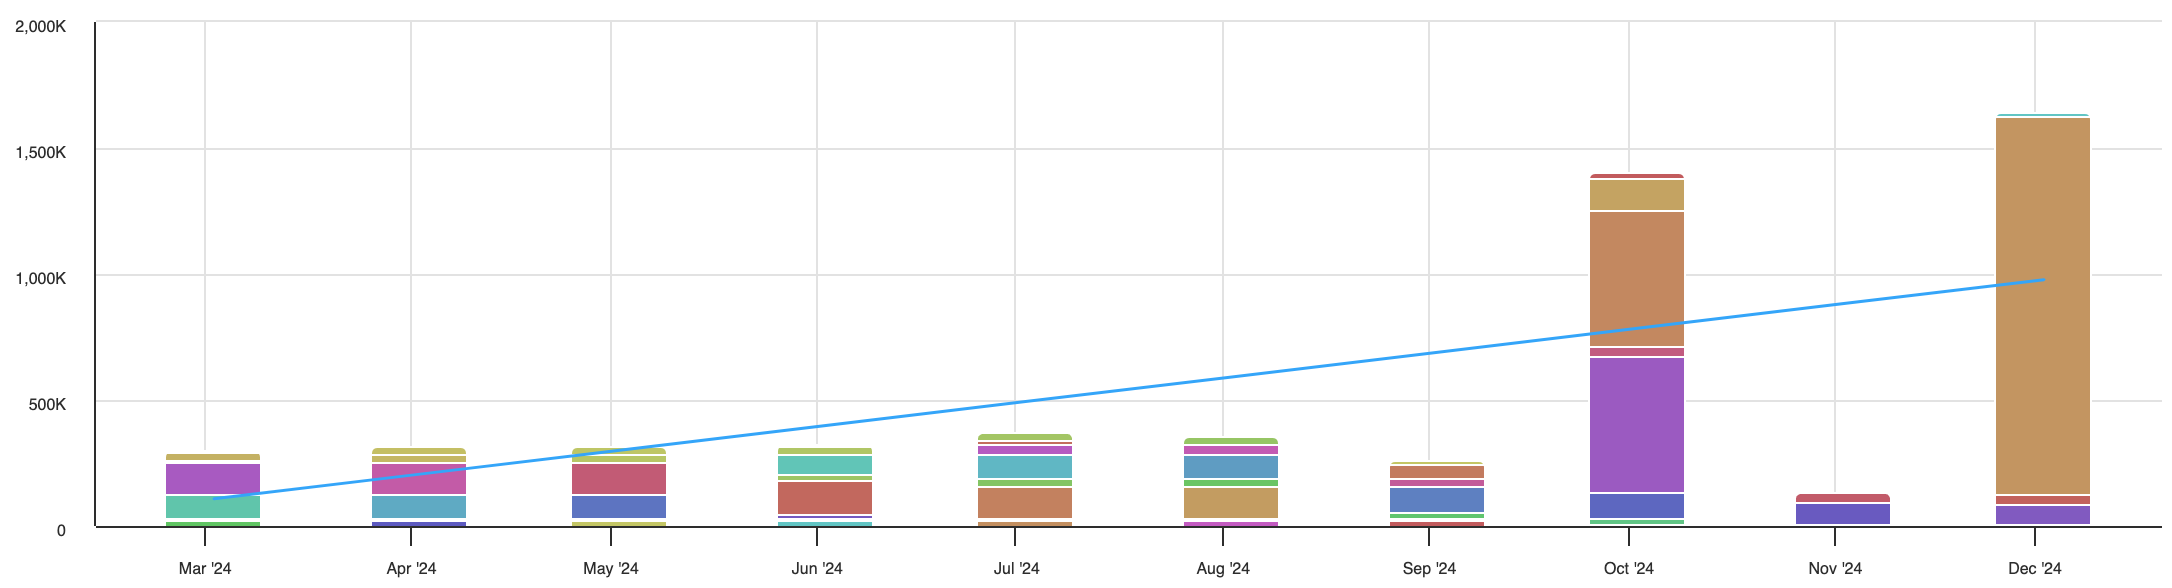
Financial bar chart showing with a trend line.
Core Concepts and Terminology
Understanding the core concepts and terminology in financial graph analysis is crucial for effectively interpreting and leveraging financial data visualizations. Key terms include:
- Price and Time Axes: Foundational to all financial graphs, indicating the price levels and the time period covered.
- Volume: Represents the number of shares or contracts traded in a given period, often depicted as bars.
- Trends: Directional movements in the market, categorized as upward, downward, or sideways.
- Support and Resistance Levels: Price points on a graph where the market trend is likely to pause or reverse.
- Moving Averages: Indicators that smooth out price data to identify the trend direction over a specific period.
Familiarity with these terms enhances the ability to analyze and interpret financial graphs, providing a solid foundation for advanced financial analysis.
Different Types of Financial Graphs and Their Uses
Financial graphs come in various formats, each serving specific analytical purposes:
- Line Charts: Ideal for visualizing price trends over time, providing a clear overview of market movements.
- Bar Graphs: Useful for comparing data points between different groups, often used to display financial metrics across different periods.
- Candlestick Charts: Offer detailed information about price movements within a specific period, showing open, high, low, and close prices.
- Pie Charts: Commonly used for portfolio analysis, illustrating the distribution of assets or investment allocations.
Each graph type offers unique insights, catering to different aspects of financial analysis.
Line Charts and Their Interpretation
Line charts are fundamental in financial graph analysis, tracing the closing prices of securities over time to reveal trends and patterns. These charts provide a clear, simplified view of market movements, making it easier to identify upward, downward, or sideways trends. The slope of the line indicates the market's direction, while points where the line changes direction signal potential reversals.
By analyzing these trends, investors can make informed decisions on entry and exit points in the market.
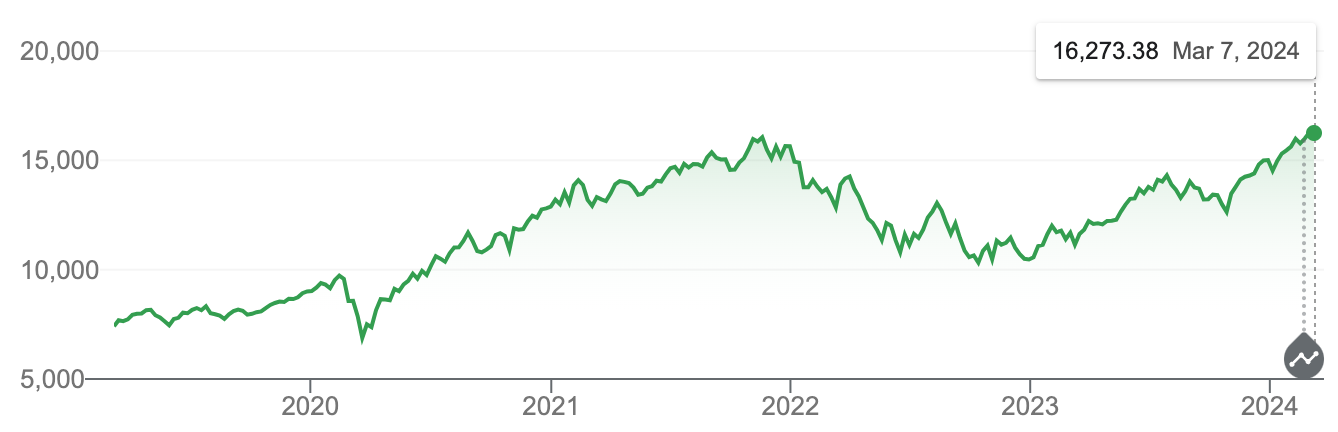
A line chart of market trends during a five-year period.
Bar Graphs in Financial Analysis
Bar graphs in financial analysis are versatile tools used to compare and contrast various data points, such as revenue, profit, and expenses, across different time periods or categories. They offer a visual representation that makes disparities and trends immediately apparent, facilitating quick assessments and strategic decision-making. By illustrating data in a straightforward, easy-to-understand format, bar graphs enable analysts and investors to identify patterns, measure performance, and evaluate financial health effectively.
Example financial bar graph.
The Significance of Candlestick Charts
Candlestick charts are crucial in financial analysis for their detailed representation of price movements within a specific timeframe. Each candlestick displays the open, high, low, and close prices, offering insights into market sentiment and potential future movements. The color and shape of the candlestick can indicate bullish or bearish trends, helping investors to make informed decisions about buying or selling. The patterns formed by these candlesticks can signal reversals or continuations of trends, making them invaluable for technical analysis.
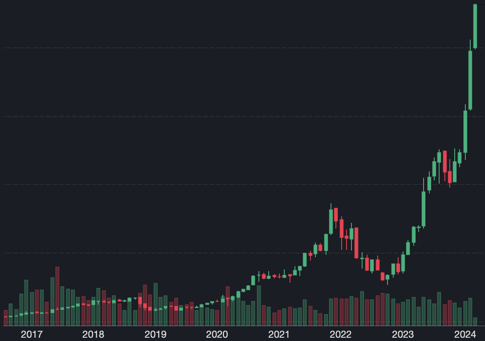
A candlestick chart of stock price movements.
Pie Charts for Portfolio Distribution
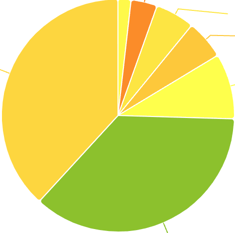 Pie charts are instrumental in visualizing portfolio distribution, offering a clear, intuitive breakdown of asset allocations within a portfolio. By segmenting the portfolio's components—such as stocks, bonds, and cash—into slices proportional to their value, pie charts help investors and analysts quickly grasp the diversification and risk exposure of their investments. This visual tool facilitates strategic decision-making by highlighting areas of concentration and potential imbalances, guiding adjustments to align with investment goals and risk tolerance.
How to Read and Interpret Financial Graphs
Reading and interpreting financial graphs involves understanding the underlying data and recognizing key patterns that can inform investment decisions. Here are essential steps and considerations:
- Identify the Time Frame: Determine the period over which the data is plotted to understand the context of the analysis.
- Analyze Price Movements: Look for trends in the price data, noting any upward, downward, or sideways movement.
- Understand Volume Data: High volume can confirm a trend, indicating strong buyer or seller interest.
- Recognize Patterns: Familiarize yourself with common chart patterns and what they signify for future movements.
Key elements to focus on include:
- Trends (upward, downward, sideways)
- Volume and its significance in confirming trends
- Support and resistance levels
- Indicators (Moving Averages, RSI, MACD)
Interpreting financial graphs correctly is crucial for making informed investment decisions, identifying entry and exit points, and managing risk.
Analyzing Trends and Patterns
Analyzing trends and patterns in financial graphs involves identifying the direction and strength of price movements over time. Trends can be upward, indicating bullish sentiment, downward for bearish sentiment, or sideways, showing market indecision. Recognizing these patterns helps predict future price movements.
Key patterns, such as head and shoulders or double tops and bottoms, provide insights into potential market reversals, while continuation patterns like flags and pennants suggest the persistence of the current trend. Understanding these trends and patterns is crucial for effective market analysis and decision-making.
Understanding Volume and Its Impact
Volume in financial graphs represents the number of shares or contracts traded during a given period and is a crucial indicator of the strength behind price movements. High volume alongside price increases suggests strong buyer interest, whereas high volume with price decreases indicates strong seller interest. Volume can confirm trends, with rising volume on uptrends and declining volume on downtrends signaling strong market consensus.
Understanding volume's impact is essential for assessing the momentum and potential sustainability of price movements, aiding in more informed investment decisions.
The Role of Indicators in Graph Analysis
Indicators play a pivotal role in financial graph analysis, offering quantitative insights that help predict future market movements. Common indicators include:
- Moving Averages: Indicate the average price over a specific period, helping to smooth out price volatility and identify trends.
- Relative Strength Index (RSI): Measures the speed and change of price movements to identify overbought or oversold conditions.
- MACD (Moving Average Convergence Divergence): Shows the relationship between two moving averages of a security's price, indicating trend reversals.
These tools are essential for making informed trading decisions, allowing analysts to interpret market conditions more accurately.
Advanced Techniques in Financial Graph Analysis
Advanced techniques in financial graph analysis leverage sophisticated tools and methodologies to extract deeper insights from market data. These include:
- Technical vs. Fundamental Analysis: Combining chart patterns with economic indicators for a comprehensive market view.
- Predictive Analysis Using Historical Data: Employing statistical models to forecast future price movements based on past trends.
- Integrating Machine Learning for Enhanced Insights: Applying AI algorithms to identify complex patterns and predictive signals in market data.
These techniques offer nuanced perspectives, enabling analysts to navigate market complexities with greater precision.
Technical Versus Fundamental Analysis
Technical analysis focuses on statistical trends derived from trading activity, such as price movement and volume, using charts to predict future movements. Fundamental analysis, on the other hand, evaluates a company's financial health and intrinsic value by analyzing financial statements, market share, and other economic indicators.
While technical analysis is short-term and based on market psychology, fundamental analysis is long-term and grounded in economic realities, making them complementary strategies for informed investment decisions.
Predictive Analysis Using Historical Data
Predictive analysis uses historical data to forecast future market trends and price movements. By examining patterns, cycles, and correlations in past market behavior, analysts can develop models that predict future activities. This approach is grounded in the belief that historical market movements are indicative of future performances, allowing investors to make more informed decisions based on likely future scenarios. Advanced statistical and machine learning techniques are often employed to enhance the accuracy of these predictions.
Integrating Machine Learning for Enhanced Insights
Machine learning integration into financial graph analysis revolutionizes how data is interpreted, enabling the identification of non-linear patterns and complex relationships that traditional methods might miss.
By analyzing vast datasets, machine learning algorithms can uncover hidden trends, predict market movements, and provide actionable insights with a higher degree of accuracy. This advanced approach allows for more sophisticated analysis and forecasting, significantly enhancing decision-making processes in the financial sector.
Challenges and Ethical Considerations
Financial graph analysis, while powerful, faces challenges and ethical considerations. Analysts must navigate the reliability of data sources, the potential for overfitting models, and the risk of confirmation bias in interpreting data. Ethically, there's a responsibility to use data honestly and avoid manipulating findings for personal gain. Transparency in methodology and acknowledging uncertainties are essential to maintain trust and integrity in financial analysis.
Recognizing the Limitations of Graph Analysis
It's crucial to acknowledge the limitations of financial graph analysis, including its reliance on historical data that may not accurately predict future movements. Graph analysis can be subjective, with interpretations varying among analysts. Additionally, it cannot account for all market-influencing factors, such as unexpected geopolitical events or changes in regulations, highlighting the need for a comprehensive approach that includes other analytical methods.
Ethical Trading and Analysis Practices
Ethical trading and analysis practices emphasize integrity and responsibility in financial analysis and trading. This involves transparently sharing methodologies, avoiding manipulation of data for misleading conclusions, and adhering to regulatory standards. Ethical practices ensure that analysis is conducted fairly, decisions are made in the best interest of clients, and market integrity is maintained, contributing to a more trustworthy and stable financial environment.
Future Trends and Innovations in Financial Graph Analysis
The landscape of financial graph analysis is rapidly evolving, driven by technological advancements and new analytical methodologies. Here are key areas to watch:
- Technological Advancements
- AI and Machine Learning: Enhanced predictive models through deep learning algorithms.
- Blockchain: Increased transparency and security in financial transactions.
- Cloud Computing: Greater data storage and computing power for complex analyses.
- Analytical Methodologies
- Big Data Analytics: Leveraging vast datasets for more comprehensive market insights.
- Quantitative Models: Sophisticated models for risk assessment and portfolio management.
- Behavioral Finance: Incorporating psychological factors into financial decision-making.
These trends promise to refine financial graph analysis further, offering deeper insights and more accurate predictions.
The Evolution of Financial Analysis Tools
The evolution of financial analysis tools is marked by significant technological advancements, transitioning from basic charting techniques to sophisticated software incorporating AI, machine learning, and big data analytics. These tools now offer unprecedented capabilities for data processing, visualization, and predictive modeling, enabling analysts to perform more complex analyses with greater accuracy and efficiency.
The integration of blockchain technology also promises enhanced security and transparency in financial transactions, further revolutionizing the field.
Big Data and Its Impact on Financial Analysis
Big Data has transformed financial analysis by enabling more granular, real-time market insights. It allows for the processing of vast volumes of data from diverse sources, leading to more accurate predictions and strategies. Big Data's impact includes enhanced risk management, personalized investment strategies, and the identification of market trends not visible through traditional analysis. This evolution signifies a shift towards data-driven decision-making in finance, offering a competitive edge to those who effectively harness Big Data capabilities.
Conclusion
This article has navigated through the basics of financial graph analysis, from understanding its importance and foundational concepts to exploring advanced techniques and future trends. While financial graphs are powerful tools for market analysis, recognizing their limitations and adhering to ethical practices is crucial.
As technology and methodologies evolve, staying informed and adaptable will be key for analysts and investors aiming to harness the full potential of financial graph analysis for informed decision-making in the dynamic landscape of finance.
About the Author
Caroline Scharf, VP of Operations at Tom Sawyer Software, has more than 25 years leadership experience at large and small software companies. She has a passion for process and policy in streamlining operations, a solution-oriented approach to problem solving, and is a strong advocate of continuous evaluation and improvement.
FAQ
What are the most common mistakes to avoid when interpreting financial graphs?
One common mistake is failing to consider the broader market context or external factors such as geopolitical events or economic reports that could affect market behavior. Another is overreacting to short-term fluctuations without considering long-term trends, which may lead to impulsive decisions. Misinterpreting technical indicators, such as misunderstanding the significance of support and resistance levels or relying on volume without context, can also result in inaccurate conclusions. To avoid these pitfalls, it's crucial to combine technical analysis with broader market insights and to ensure the use of multiple timeframes for a balanced view.
How do different types of financial graphs complement each other in market analysis?
Each type of financial graph serves a distinct purpose and provides unique insights. Line charts excel at highlighting overall market trends over time, making them useful for long-term investment planning. On the other hand, Candlestick charts offer detailed, granular views of price action in shorter time frames, providing critical information about market sentiment within a single trading session. Bar graphs can be used to compare financial metrics like revenue or profit across different periods, adding another layer of context to the analysis. By integrating these graphs, investors can create a comprehensive picture of both the macro and micro elements of market performance, ensuring more accurate strategic decisions.
How does volume impact the interpretation of price movements in financial graphs?
Volume acts as a confirmation of price movement strength. A price increase accompanied by high volume suggests strong investor interest, and the upward trend is likely to be sustained. Conversely, if a price rises but the volume remains low, it may indicate that the trend lacks conviction, signaling a potential reversal. Similarly, high volume on a price decrease may show strong selling pressure, which could reinforce the downward movement. In contrast, low volume during a decline may signal that the market lacks consensus, potentially leading to a recovery. Thus, understanding volume alongside price action provides critical insights into the sustainability and direction of market trends.
How can predictive analysis enhance financial graph interpretation?
Predictive analysis uses historical data to forecast future price movements, helping investors anticipate market behavior based on past trends. This method can enhance financial graph interpretation by identifying patterns like cycles, trends, or seasonality that may indicate future shifts. By leveraging statistical models, such as moving averages or regression analysis, predictive techniques can highlight areas of potential price reversals or continuations. Machine learning and AI further amplify predictive analysis by recognizing subtle patterns in large datasets that are difficult to detect manually. This leads to more accurate forecasting, helping investors make better-informed decisions, especially in highly volatile or uncertain markets.
Why is it important to use both technical and fundamental analysis when analyzing financial graphs?
Technical and fundamental analysis offer complementary insights, providing a more holistic view of market conditions. Technical analysis focuses on price trends, patterns, and volume data to predict short-term market movements, essential for timing trades and managing entry and exit points. On the other hand, fundamental analysis evaluates a company's financial health, looking at factors like earnings, revenue growth, market share, and industry conditions, which influence the long-term value of an asset. By integrating both approaches, investors can align short-term market actions with long-term financial stability, leading to more informed, balanced investment strategies that mitigate risks and capitalize on opportunities.
Submit a Comment