
Max Chagoya
Big Data Graph Analysis is redefining the landscape of data interpretation, offering insights through the examination of complex relationships within extensive datasets. It integrates the vast, intricate world of big data with graph theory's nuanced explorations of connections, showcasing a powerful tool for understanding the hidden patterns and dynamics that traditional analytical methods might overlook.
This approach illuminates data interactions, providing an informative perspective on information analysis that enhances decision-making and strategic planning across various sectors.
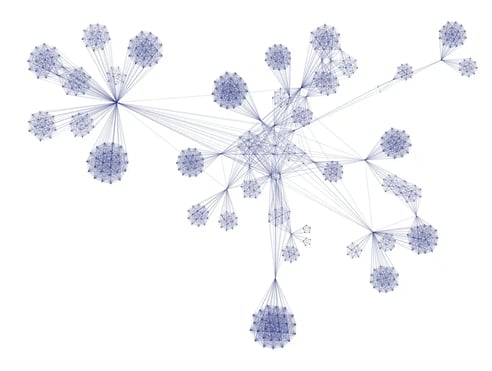
A large graph exposing the connections between elements.
Introduction to Big Data Graph Analysis
In an era where data is akin to the lifeblood of innovation, Big Data Graph Analysis emerges as a pivotal technology reshaping our approach to data intelligence. It's a sophisticated synergy of big data—vast pools of information generated at high velocity, varying in complexity and format—and graph analysis, a methodical approach to understanding and visualizing data through graphs.
This amalgamation not only enhances our ability to decipher intricate data relationships but also propels decision-making processes across myriad industries.
What is Big Data?
Big Data encapsulates the immense volume of data that inundates businesses and organizations daily. Characterized by its volume, velocity, variety, veracity, and value, Big Data's complexity requires advanced tools and technologies for efficient processing and analysis. It encompasses structured, semi-structured, and unstructured data, each playing a crucial role in analytics.
What is Graph Analysis?
Graph Analysis stands at the forefront of analytical techniques, employing nodes and edges to represent and explore relationships within data. This approach is instrumental in unveiling patterns and insights hidden within the connections of complex datasets, offering a dynamic view of data interactions and dependencies.
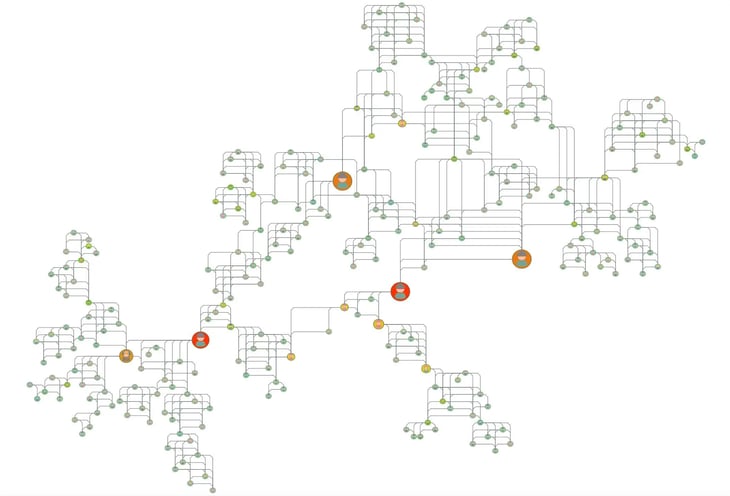
A graph analysis of a criminal network.
The Importance of Big Data Graph Analysis
The convergence of Big Data and Graph Analysis heralds a new epoch in data analytics. By enabling a granular examination of data relationships, Big Data Graph Analysis unlocks a spectrum of possibilities, from enhancing cybersecurity measures to driving personalized customer experiences. It holds the key to untangling the complexities of vast datasets, offering a roadmap to actionable insights that drive innovation and strategic growth.
Expanding on the importance of Big Data Graph Analysis, it's essential to recognize how it's fundamentally reshaping our approach to data across sectors. This analytical method offers insights by mapping the connections within massive datasets, revealing patterns and relationships that traditional analytics might miss.
Big Data Graph Analysis is instrumental in several key areas:
- Advancing Scientific Research: In fields like genomics and epidemiology, graph analysis helps understand complex biological networks and disease spread.
- Optimizing Supply Chains: By analyzing relationships between various components and suppliers, companies can identify bottlenecks and optimize for efficiency.
- Enhancing Network Security: Graph analysis is crucial in detecting unusual patterns that may indicate security breaches or cyberattacks.
- Improving Financial Services: From fraud detection to credit risk assessment, financial institutions leverage graph analysis to secure and personalize their services.
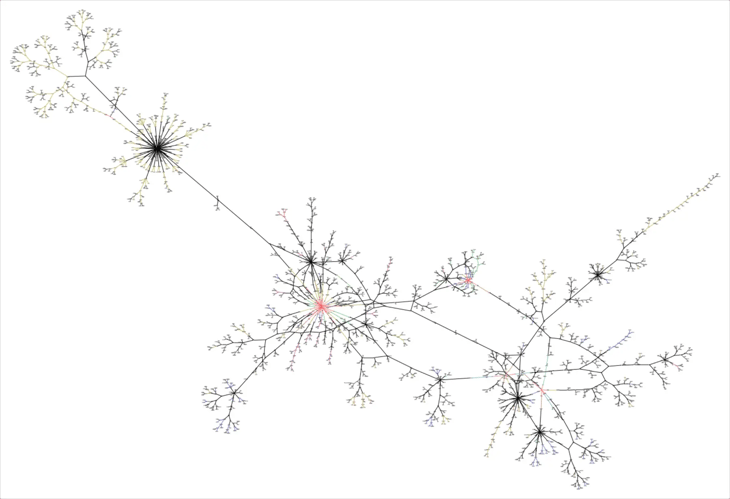
A graph of the spread of the Coronavirus.
The key benefits of graph analysis include:
- Deepens Data Comprehension: Allows for a more nuanced understanding of the underlying structures and dynamics within datasets.
- Drives Operational Efficiency: Identifies inefficiencies within organizational processes, enabling more streamlined operations.
- Facilitates Innovation: Uncovers hidden patterns and insights can lead to the development of new products, services, and strategies.
- Enhances Decision Making: Provides a data-driven foundation for making strategic decisions, reducing uncertainty and enhancing outcomes.
In essence, Big Data Graph Analysis is not just an analytical tool but a strategic asset that empowers organizations to navigate the complexities of the digital age with greater agility and insight. Its ability to transform vast amounts of unstructured data into actionable intelligence makes it indispensable for forward-thinking entities aiming to maintain a competitive edge in their respective domains.
Key Concepts in Big Data Graph Analysis
Understanding the foundational elements of Big Data Graph Analysis is pivotal in today's data-driven landscape. At its core, graph theory provides the framework for modeling complex relationships through nodes and edges, enabling a granular view of interconnected data. The utilization of various graph types, such as directed, undirected, weighted, and multigraphs, allows for nuanced analysis tailored to specific research needs or project goals.
Additionally, the advent of graph databases like Neo4j, Amazon Neptune, and Microsoft Azure Cosmos DB has revolutionized how we store and query graph-structured data, offering efficient, scalable solutions for handling large datasets.
These key concepts form the backbone of Big Data Graph Analysis, empowering data scientists and analysts to uncover deep insights and drive innovation across numerous domains. We will explore these aspects further in sections on Graph Theory Basics, Types of Graphs in Big Data, and Graph Databases and Technologies.
Graph Theory Basics
At the heart of Big Data Graph Analysis lies Graph Theory, an area of mathematics focused on studying graphs, which are mathematical structures used to model pairwise relations between objects. A graph is made up of vertices (or nodes) connected by edges (or links). In the context of big data, nodes can represent anything from individuals in a social network to entities in a database, while edges denote the relationships or interactions between these nodes.
Understanding the basics of graph theory is essential for anyone looking to harness the power of Big Data Graph Analysis, as it provides the tools needed to map and analyze complex networks in a structured and insightful manner.
Types of Graphs in Big Data
Big Data Graph Analysis utilizes various types of graphs to model different kinds of relationships and interactions. Some of the most common include:
- Directed Graphs (Digraphs): Where edges have a direction, indicating the relationship flows from one node to another.
- Undirected Graphs: Where the edges lack direction, signifying a bidirectional relationship between nodes.
- Weighted Graphs: Where edges carry weights, representing the strength or capacity of the connection between nodes.
- Unweighted Graphs: Where all edges are considered equal.
- Multigraphs: Where multiple edges can exist between the same set of nodes, allowing for the representation of multiple relationships.
Each graph type offers a unique way to interpret data relationships, making it possible to tailor the analysis to the specific needs of a project or research endeavor.
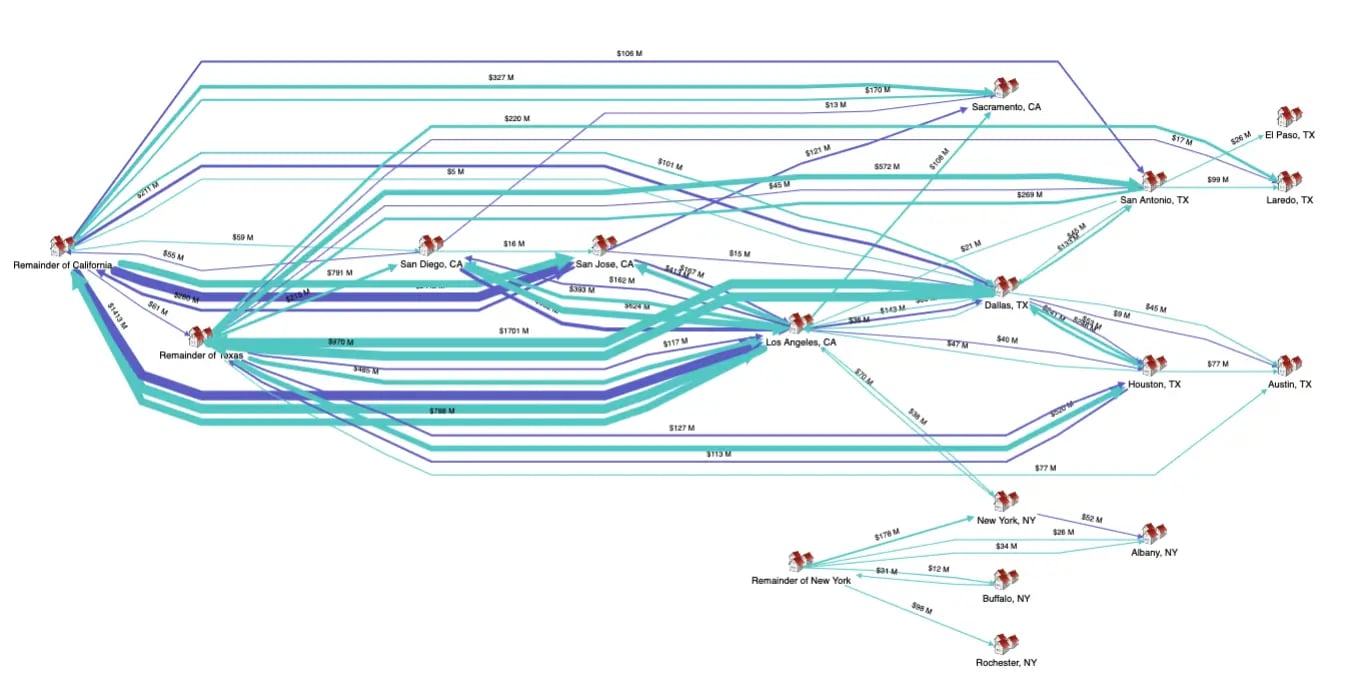
A weighted graph of the flow of commodities across geographic locations.
Graph Databases and Technologies
To facilitate the analysis of graphs, especially in the context of Big Data, a variety of graph databases and technologies have been developed. These tools are designed to store and manage graph-structured data efficiently, providing fast access to complex queries that explore the relationships within the data. Examples of popular graph databases include Neo4j, Amazon Neptune, and Microsoft Azure Cosmos DB, each offering unique features and capabilities suited for different applications of Big Data Graph Analysis.
Understanding these key concepts is fundamental to leveraging Big Data Graph Analysis effectively. They provide the groundwork upon which more advanced techniques and applications are built, enabling analysts and data scientists to uncover deep insights into the data that drives our world.
Applications of Big Data Graph Analysis
Big Data Graph Analysis is not merely a theoretical construct but a practical tool with wide-ranging applications, from enhancing social media analytics to bolstering cybersecurity, refining recommendation engines, and streamlining network infrastructure management.
Each application highlights the technology's versatility and its capacity to provide deep insights that drive innovation, improve user experiences, and solve complex problems in novel ways. By harnessing the power of Big Data Graph Analysis, organizations can unlock the full potential of their data, revealing patterns and connections that lie at the heart of strategic decision-making and operational efficiency.
The versatility of Big Data Graph Analysis extends across various industries, enabling breakthroughs and enhancements in fields such as healthcare, where it's used to understand genetic information networks. In finance, it aids in detecting fraud by analyzing transaction networks, while in logistics, it optimizes routes and supply chains through complex network analysis. Its application in environmental science helps model climate change effects and biodiversity networks, showcasing its ability to tackle critical global challenges.
- Healthcare: Mapping genetic relationships
- Finance: Identifying fraudulent transactions within banking networks.
- Logistics: Optimizing supply chains and delivery routes.
- Environmental Science: Modeling ecosystems and climate change impacts.
- Telecommunications: Enhancing network infrastructure and optimizing connectivity.
By integrating Big Data Graph Analysis, organizations can navigate the complexities of their respective fields more effectively, leading to smarter decisions, enhanced efficiency, and innovative solutions to longstanding problems.
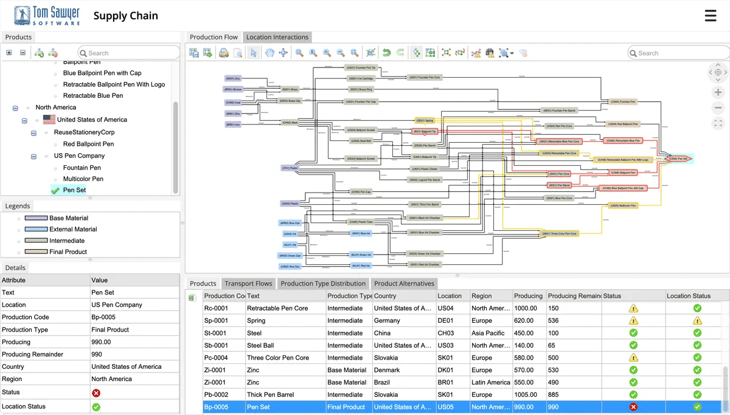
An example supply chain visualization and analysis application.
Social Network Analysis
One of the most prominent applications of Big Data Graph Analysis is in the study and optimization of social networks. By mapping the connections between individuals, organizations, and content, analysts can identify influential nodes, understand community structures, and track the flow of information or trends across networks. This insight is invaluable for targeted marketing, misinformation studies, and enhancing user engagement strategies.
Fraud Detection and Security
In the realm of cybersecurity and fraud prevention, Big Data Graph Analysis offers a potent tool for identifying suspicious patterns of behavior that deviate from the norm. By analyzing the relationships and transactions between entities within large datasets, it becomes possible to pinpoint potential fraudsters, uncover hidden networks of malicious actors, and enhance the security of financial systems.
Recommendation Systems
Graph Analysis also plays a crucial role in the development of sophisticated recommendation systems. By understanding the relationships between users and products or content, these systems can deliver highly personalized recommendations that significantly improve user experience and satisfaction. This application is particularly prevalent in e-commerce and streaming services, where the ability to predict user preferences can directly impact business success.
Network and Infrastructure Analysis
The optimization of network and infrastructure operations is another area where Big Data Graph Analysis excels. Whether it's managing logistics networks, optimizing internet traffic routing, or ensuring the reliability of energy distribution systems, understanding the complex relationships and dependencies within these networks is key. Graph Analysis provides the insights necessary to enhance efficiency, reduce costs, and improve service delivery in these critical sectors.
These applications showcase the versatility and power of Big Data Graph Analysis in extracting meaningful insights from complex datasets. By leveraging the intricate relationships mapped out by graph theory, organizations across industries can address some of their most challenging problems and capitalize on new opportunities in an increasingly data-driven world.
Challenges in Big Data Graph Analysis
As organizations strive to extract meaningful insights from vast datasets, they encounter a series of challenges that can impede their efforts to fully leverage the power of Big Data Graph Analysis. This exploration is crucial for understanding the limitations and formulating strategies to overcome these obstacles, ensuring that the benefits of graph analysis can be realized across various applications.
Scalability Issues
One of the foremost challenges in Big Data Graph Analysis is scalability. As the size of datasets grows exponentially, the computational resources required to process and analyze these graphs also surge. Traditional graph databases and analytics tools may struggle to manage the volume, velocity, and complexity of big data, leading to bottlenecks in data processing and analysis.
Data Quality and Integration
The quality and integration of data pose significant challenges in Big Data Graph Analysis. Inconsistent, incomplete, or inaccurate data can lead to misleading insights and erroneous conclusions. Moreover, integrating data from diverse sources and formats into a unified graph model requires sophisticated preprocessing and normalization techniques to ensure that the analysis is based on reliable and coherent datasets.
Privacy and Security Concerns
Privacy and security concerns are paramount in Big Data Graph Analysis. The nature of graph data, which often includes sensitive information about individuals' relationships and interactions, necessitates stringent data protection measures. Ensuring the anonymity and privacy of subjects while maintaining the integrity and utility of the graph for analysis is a delicate balance that must be carefully managed.
Future Trends in Big Data Graph Analysis
As technology advances and the volume of data continues to grow, Big Data Graph Analysis is poised to become an even more integral tool in extracting actionable insights from complex datasets. This forward-looking perspective provides a glimpse into the potential advancements that will enhance the capabilities, efficiency, and applicability of graph analysis technologies.
As we look towards the future, Big Data Graph Analysis is set to undergo transformative changes that will redefine its impact across industries. The integration of quantum computing will significantly enhance the processing capabilities, enabling real-time analysis of even larger datasets. Advances in AI and machine learning algorithms will lead to more sophisticated, predictive analytics models, further enhancing decision-making processes. Moreover, we'll see a greater emphasis on privacy-preserving graph analytics, ensuring data security while extracting valuable insights.
The evolution of graph databases will also continue, with more scalable, efficient, and user-friendly platforms becoming available. These advancements promise to expand the applicability of Big Data Graph Analysis, making it an indispensable tool for tackling the complex challenges of the digital age.
Advances in Graph Databases and Analytics Tools
The evolution of graph databases and analytics tools is at the forefront of future trends in Big Data Graph Analysis. We can expect to see more sophisticated, scalable, and user-friendly solutions that can handle increasingly complex and voluminous datasets with ease. These advancements will likely include enhanced query languages, improved data indexing and retrieval methods, and more efficient algorithms for real-time graph analytics.
Integration with AI and Machine Learning
Another significant trend is the deeper integration of Big Data Graph Analysis with artificial intelligence (AI) and machine learning (ML) technologies. By combining the relational insights of graph analysis with the predictive power of AI and ML, organizations can unlock new levels of understanding and forecasting abilities. This synergy will enable more accurate predictions, dynamic network analysis, and the automation of complex decision-making processes.
The Growing Importance of Real-time Graph Analytics
As businesses and organizations increasingly require up-to-the-minute information, the demand for real-time graph analytics will grow. Real-time analysis allows for the immediate detection of patterns, anomalies, and trends within dynamically changing data. This capability is crucial for applications such as fraud detection, network security, and operational monitoring, where timely information can make a significant difference in outcomes.
Conclusion: The Future of Big Data Graph Analysis
In conclusion, the future of Big Data Graph Analysis is bright, with its potential only beginning to be tapped. As technology continues to advance and our world becomes increasingly interconnected, the insights derived from graph analysis will become ever more critical in driving decision-making and innovation. The journey ahead is filled with opportunities to further explore the depths of big data, revealing the intricate patterns and connections that lie at the heart of our digital age. Big Data Graph Analysis stands at the forefront of this exploration, ready to unlock the next wave of discoveries that will propel us into the future.
About the Author
Max Chagoya is Associate Product Manager at Tom Sawyer Software. He works closely with the Senior Product Manager performing competitive research and market analysis. He holds a PMP Certification and is highly experienced in leading teams, driving key organizational projects and tracking deliverables and milestones.
FAQ
How does Big Data Graph Analysis differ from traditional data analysis methods?
Big Data Graph Analysis focuses on the relationships between data points, unlike traditional methods that typically focus on individual data values. It excels in uncovering patterns, connections, and dependencies within large datasets, offering deeper insights into data structure and behavior. This is particularly useful for identifying hidden trends or complex network interactions that traditional linear analysis might overlook.
What are the practical steps to implement Big Data Graph Analysis in an organization?
To implement Big Data Graph Analysis, organizations should identify key areas where relationships between data points are critical, such as network security, supply chain management, or customer analytics. Next, adopting the right graph database technology (e.g., Neo4j, Amazon Neptune) is essential. Data engineers must then preprocess and structure their data into nodes and edges before applying relevant graph algorithms to gain insights. Finally, it's important to build internal expertise or consult with experts to leverage the full potential of graph analysis.
What challenges should organizations expect when scaling Big Data Graph Analysis?
Scaling Big Data Graph Analysis involves handling larger datasets and more complex relationships, which can strain both computational resources and existing data infrastructures. Organizations may face challenges with data integration, as ensuring consistency across varied data sources is difficult. Additionally, performance bottlenecks can occur during graph processing, requiring efficient graph algorithms and scalable database solutions. Privacy and security concerns also grow as datasets expand, particularly in sensitive fields like healthcare and finance.
Can Big Data Graph Analysis be integrated with existing AI and machine learning models?
Yes, Big Data Graph Analysis can enhance AI and machine learning models by providing relational data insights that help improve prediction accuracy. For instance, graph-based features like node centrality or cluster memberships can be incorporated into machine learning models to enhance fraud detection, recommendation systems, and more. Additionally, graph neural networks (GNNs) are an emerging area where graph structures directly inform deep learning models, leading to more sophisticated and accurate analyses.
What role does visualization play in Big Data Graph Analysis, and why is it important?
Visualization is crucial in Big Data Graph Analysis as it transforms complex relationships and connections within datasets into intuitive visual formats, making it easier for analysts and decision-makers to spot patterns, trends, and anomalies. Graph visualizations help in understanding intricate data interactions that might be missed with raw data alone. By making data more accessible, visualizations also enhance collaboration across teams, allowing non-technical stakeholders to grasp key insights and contribute to strategic decisions.
How can organizations ensure the quality and reliability of data used in Big Data Graph Analysis?
Ensuring data quality involves several key steps: data cleaning to remove inconsistencies, redundancies, and inaccuracies; normalizing data from different sources to create a unified structure; and implementing data governance policies to maintain accuracy and consistency. Regular audits and validation processes are also essential to guarantee that the data feeding into graph analysis is reliable. Without these measures, insights drawn from the graph analysis could be flawed, leading to suboptimal decisions and strategies.
Submit a Comment