
Caroline Scharf
Vice President of Operations
Among the myriad tools and techniques available for data analysis, Python graph analysis stands out as a powerful method to visualize and understand intricate relationships within data. Python, with its rich ecosystem of libraries and tools, can enhance data insights through effective graph analysis, unlocking new dimensions of understanding and decision-making capabilities for businesses and researchers alike.
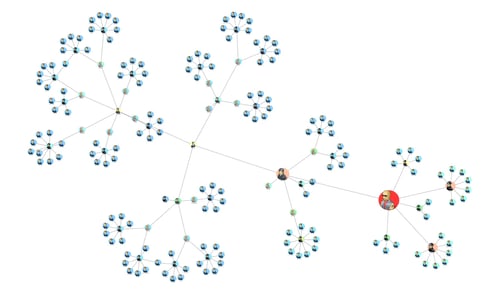
A graph visualization with centrality analysis to identify key people in a criminal network.
Why Python for Graph Analysis?
Python has emerged as a leading language in data science due to its simplicity, versatility, and the vast array of libraries it supports. For graph analysis, Python offers several powerful libraries such as NetworkX, Graph-tool, and PyGraphviz, each with unique strengths. These libraries simplify the process of implementing complex graph theory algorithms, allowing analysts to focus more on deriving insights rather than getting bogged down by the underlying mathematics. The active community and wealth of resources make Python an ideal choice for beginners and experts alike to utilize graph analysis.
Applications of Python Graph Analysis
Python graph analysis, leveraging libraries such as NetworkX, Graph-tool, and PyGraphviz, finds application across a broad spectrum of domains, each benefiting from the insights derived from complex network structures. Here are some of the key areas where Python graph analysis is making an impact:
Social Network Analysis
- Community Detection: Identifying closely-knit communities within social networks can help in understanding social dynamics, user behavior, and influence spread. Python graph analysis tools enable the detection of these communities by analyzing the patterns of connections among users.
- Influence Maximization: Understanding who the key influencers are within social networks is crucial for marketing and information dissemination strategies. Graph analysis helps identify nodes with high centrality scores, indicating their importance in the network.
Bioinformatics
- Protein Interaction Networks: Graph analysis is used to model and analyze the interactions between proteins, helping in understanding the functional organization of the proteome. This analysis can reveal insights into disease mechanisms and potential therapeutic targets.
- Genetic Linkage Analysis: By representing genetic data as graphs, researchers can uncover the relationships between different genes and their roles in hereditary diseases.
Transportation and Logistics
- Route Optimization: Graph analysis finds optimal paths through networks, which is essential for logistics and transportation planning. This includes finding the shortest paths, minimizing costs, and improving efficiency in delivery routes.
- Network Reliability Analysis: Analyzing the robustness and vulnerability of transportation networks to disruptions helps in designing more resilient infrastructure.
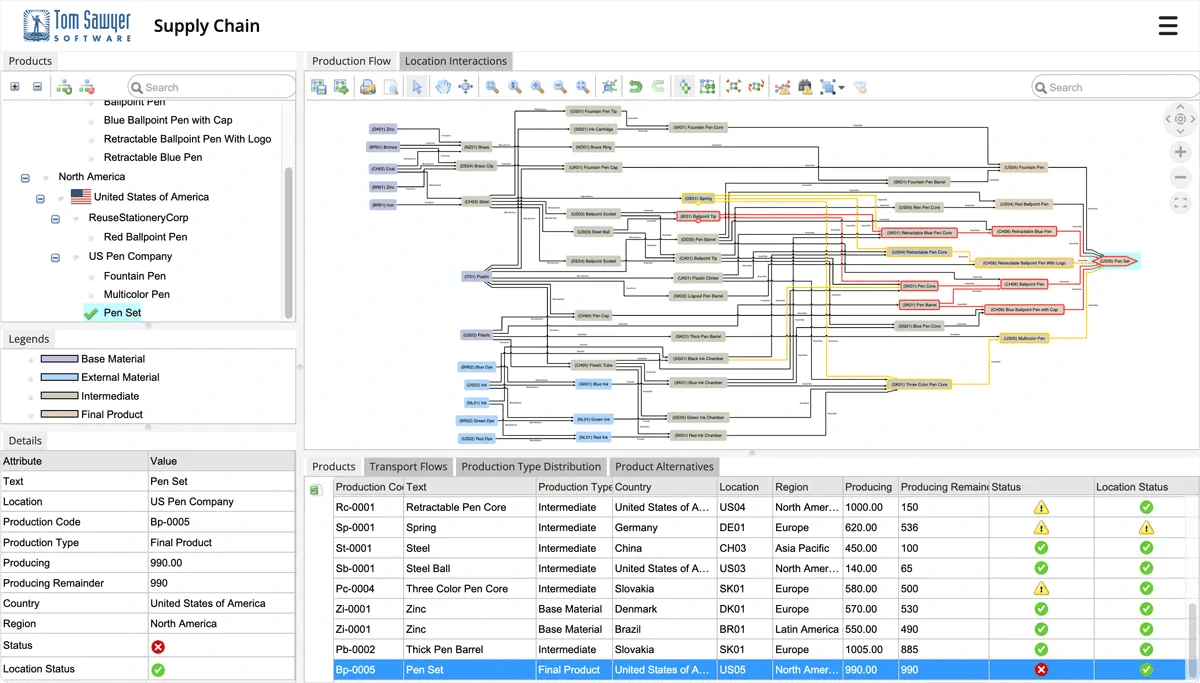
A graph visualization and analysis of vulnerabilities in a supply chain.
Financial Networks
- Fraud Detection: Graph analysis can uncover unusual patterns and connections in financial transaction data that may indicate fraudulent activities. By analyzing the network of transactions, it's possible to identify suspicious behaviors that linear analysis methods might miss.
- Market Analysis: Understanding the interconnectedness of market entities (e.g., stocks and commodities) through correlation networks can provide insights into market dynamics and risk management.
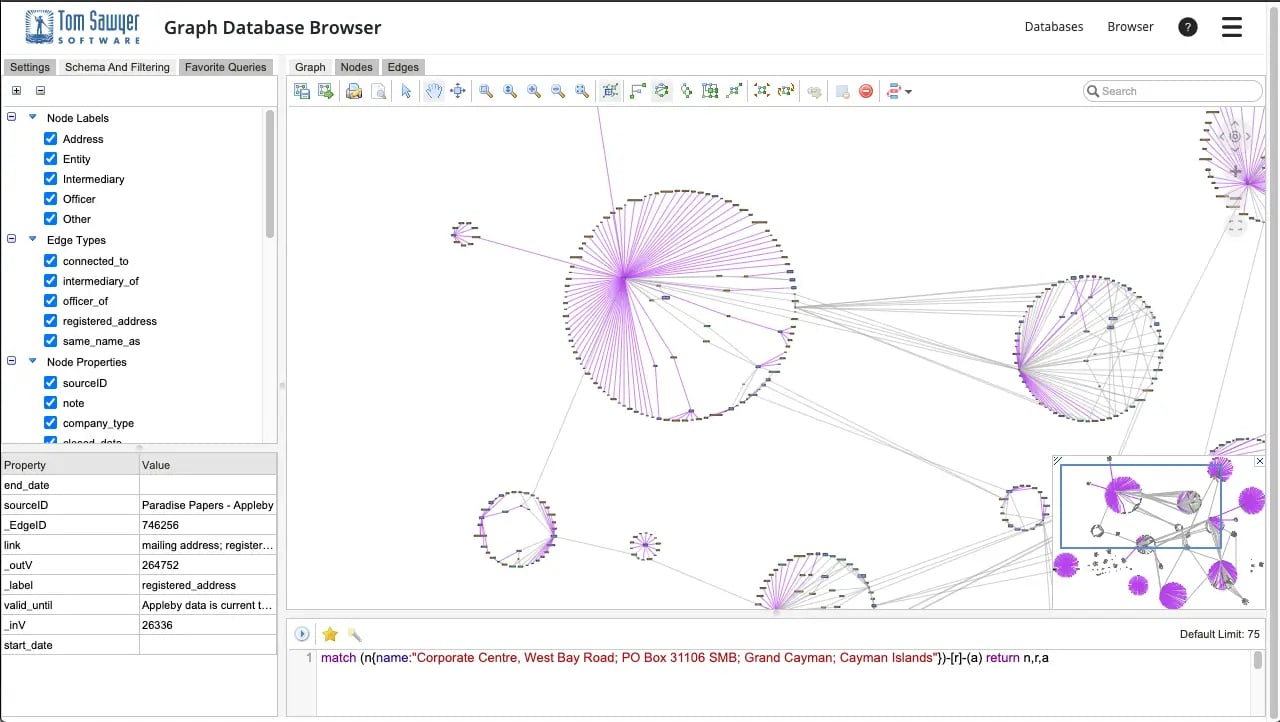
Graph visualization and analysis of the relationships in a complex financial network.
Infrastructure and Utilities
- Power Grid Analysis: Graph analysis is employed to study the structure and vulnerabilities of power grids, aiming to improve their reliability and efficiency. By modeling power grids as networks, analysts can identify critical nodes whose failure could lead to widespread outages.
- Water Distribution Networks: Optimizing the design and operation of water distribution systems through graph analysis can enhance efficiency and sustainability, ensuring reliable water supply and identifying critical points in the network.
Cybersecurity
- Network Security: Graph analysis helps identify vulnerabilities and attack pathways in network infrastructures, enabling better protection against cyber threats.
- Malware Propagation: By modeling computer networks and the pathways through which malware spreads, graph analysis can help in devising strategies to mitigate the impact of cyber attacks.
Academic Research and Education
- Citation Networks: Analyzing citation networks helps in understanding the impact of scientific work, identifying influential papers and authors, and uncovering emerging research trends.
- Learning Pathways: In education, graph analysis can model the paths through which learners acquire knowledge, helping in designing more effective curricula and personalized learning experiences.
The applications of Python graph analysis are vast and varied, touching nearly every aspect of modern life. By providing insights into the complex interconnections that define natural, social, and technological systems, Python graph analysis tools empower researchers, businesses, and policymakers to make informed decisions, optimize operations, and understand complex dynamics. As data continues to grow in size and complexity, the role of graph analysis in extracting meaningful insights from it will only become more critical.
Tools and Libraries for Graph Analysis in Python
In data science, Python has established itself as a cornerstone for graph analysis thanks to its extensive array of specialized libraries. Among these, NetworkX, Graph-tool, and PyGraphviz stand out for their powerful capabilities in handling complex graph theory algorithms and visualization tasks. However, when it comes to transforming these analyses into actionable insights through sophisticated visualizations and seamless application integration, Tom Sawyer Perspectives offers an unparalleled platform. This section explores how the analytical strengths of Python's graph analysis libraries can be seamlessly integrated with the advanced visualization and application deployment features of Tom Sawyer Perspectives, providing a comprehensive toolkit for data scientists and analysts. Together, they form a robust ecosystem enabling users to navigate from data preparation to insightful visualizations and interactive application experiences.
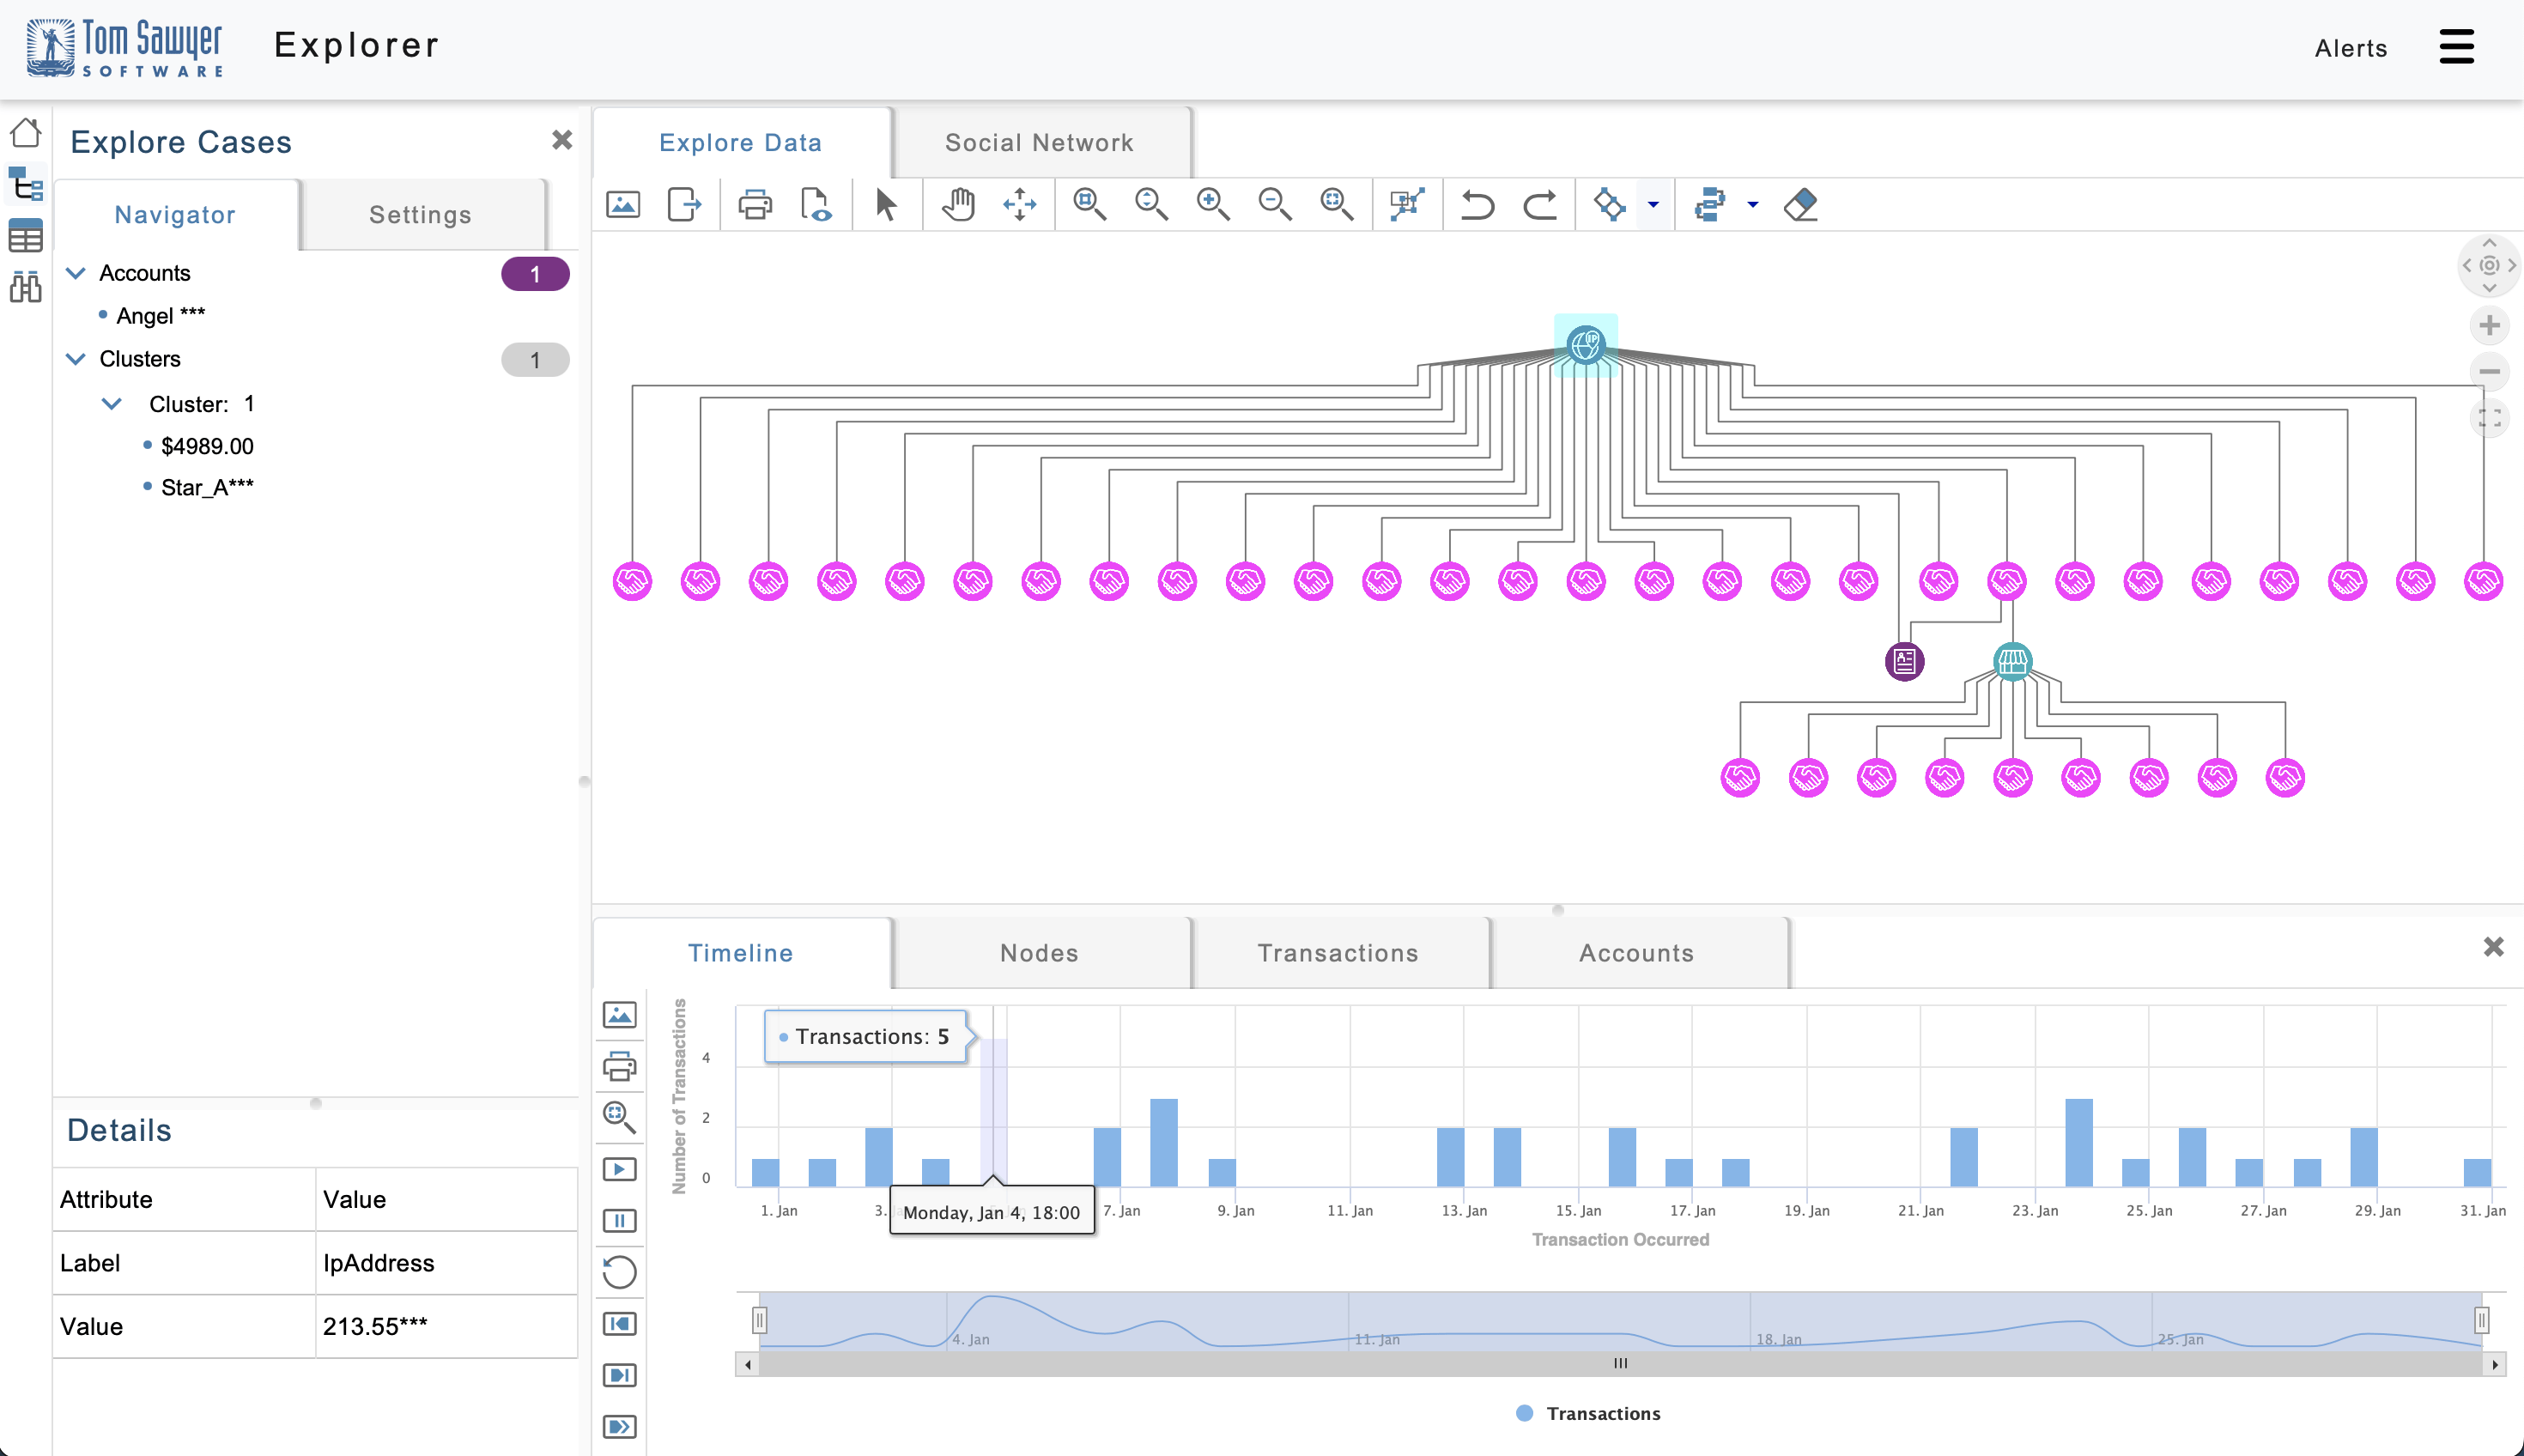
A graph visualization and timeline of financial transactions created with Tom Sawyer Perspectives.
Leveraging Python Libraries for Data Preparation and Analysis
Before visualization, data often needs to be cleaned, structured, and analyzed. Python libraries like NetworkX and Graph-tool can be instrumental in preparing graph data, performing preliminary analyses, and extracting insights, which can then be visualized using Tom Sawyer Perspectives. This preprocessing step is crucial for large or complex datasets that require manipulation or analysis beyond the capabilities of straightforward visualization tools.
While Tom Sawyer Perspectives provides robust analysis and visualization capabilities out of the box, specific projects may require custom algorithms for network analysis. Perspectives and Python libraries allow for the implementation of these specialized algorithms. The results—such as metrics, node attributes, or subgraphs identified through Python-based analysis—can be imported into Tom Sawyer Perspectives for visualization and further exploration.
Enhancing Visualization with Python Outputs
PyGraphviz, with its Graphviz foundation, excels in generating static visualizations. These can complement the interactive visualizations created with Tom Sawyer Perspectives, offering detailed diagrams or specific visual representations for inclusion in reports, presentations, or as part of a larger analysis workflow.
In a typical workflow, analysts might use Python libraries to conduct detailed graph analyses and then utilize Tom Sawyer Perspectives for its advanced visualization and interactive exploration capabilities. This approach leverages the strengths of both Python's analytical power and Tom Sawyer's sophisticated visualization and user interaction features.
Technical Integration
Integration between Python-based analysis and Tom Sawyer Perspectives can be achieved through data exchange formats such as JSON, CSV, or graph-specific formats. Python libraries can export analysis results in these formats, which can then be imported into Tom Sawyer Perspectives for visualization.
For more dynamic integration, Tom Sawyer Perspectives can be used to create web applications or services in conjunction with Python scripts or services running graph analyses.
While NetworkX, Graph-tool, and PyGraphviz are key tools for graph analysis within the Python ecosystem, their integration with Tom Sawyer Perspectives opens up powerful opportunities for visualizing and interacting with graph data. This combination enables users to harness the strengths of Python for data analysis and preprocessing while leveraging Tom Sawyer Perspectives for its advanced visualization, exploration, and application deployment capabilities. Together, they offer a comprehensive solution for tackling complex graph data challenges, from initial analysis to interactive visualization and application development.
Common Challenges in Graph Analysis
Embarking on graph analysis with Python unlocks a wealth of opportunities for data insight and exploration. However, like any sophisticated data analysis endeavor, it is accompanied by its unique set of challenges. These hurdles, ranging from data scalability to the complexity of algorithms, necessitate a strategic approach to ensure the successful application of graph analysis techniques. Understanding these challenges is the first step toward navigating them effectively and leveraging Python's full potential to derive meaningful insights from complex networks.
- Scalability: As graph data grows in size and complexity, analyzing these large graphs can become computationally intensive, testing the limits of memory and processing power. Tools like Graph-tool, which are optimized for performance, can mitigate some of these issues, but scalability remains a concern for massive datasets.
- Data Quality and Preparation: Ensuring data quality and proper preparation for graph analysis can be time-consuming. Inconsistent, incomplete, or noisy data can lead to misleading analysis results. The process of transforming raw data into a graph format that accurately represents the relationships within the data requires careful planning and execution.
- Complexity of Algorithms: Some graph algorithms, especially those involved in network optimization, community detection, and centrality analysis, can be complex both to understand and implement. This complexity can pose a barrier to entry for those new to graph analysis.
- Visualization Challenges: While visualization is a powerful tool for understanding graph data, effectively visualizing large or complex networks can be challenging. Finding the right balance between detail and clarity to convey the desired insights without overwhelming the audience requires careful planning.
Best Practices
Adhering to these best practices can help navigate the complexities of graph analysis, making your projects more successful and insightful. Python's graph analysis ecosystem is robust and versatile, but leveraging it effectively requires a thoughtful approach to both the technical and conceptual aspects of your work.
- Start with Clear Objectives: Before diving into graph analysis, clearly define what you're trying to achieve. Understanding your goals can help guide the selection of tools, algorithms, and methodologies, making your analysis more focused and efficient.
- Leverage the Right Tools: Choose the most appropriate Python library based on your specific needs. For instance, NetworkX is great for exploratory analysis and small to medium-sized graphs, while Graph-tool is better suited for large-scale graphs due to its performance optimizations.
- Focus on Data Quality: Invest time in cleaning and preparing your data before analysis. This includes removing duplicates, filling in missing values, and ensuring that the graph accurately reflects the relationships you're interested in exploring.
- Simplify When Possible: Reduce the complexity of your graphs by focusing on the most relevant nodes and edges. Simplification can help manage computational resources and make your analyses more interpretable.
- Iterate and Validate: Graph analysis is often an iterative process. Validate your findings at each step by comparing them against known benchmarks or through domain expert consultation to ensure accuracy.
- Use Visualization Effectively: Employ visualization not just as a final step but throughout your analysis process to explore data patterns and communicate findings. Tools like PyGraphviz can help in creating clear and informative visual representations.
- Stay Engaged with the Community: The Python and graph analysis communities are rich sources of knowledge, advice, and code. Engaging with these communities through forums, social media, and conferences can provide valuable insights and help overcome challenges.
About the Author
Caroline Scharf, VP of Operations at Tom Sawyer Software, has 15 years experience with Tom Sawyer Software in the graph visualization and analysis space, and more than 25 years leadership experience at large and small software companies. She has a passion for process and policy in streamlining operations, a solution-oriented approach to problem solving, and is a strong advocate of continuous evaluation and improvement.
FAQ
How do I choose between NetworkX, Graph-tool, and PyGraphviz for my graph analysis project?
Choosing the right Python graph analysis library depends on your project’s specific needs. NetworkX is ideal for small to medium-sized graphs and exploratory analysis due to its ease of use and flexibility. Conversely, Graph-tool is optimized for performance and should be your choice for analyzing large-scale networks or when computational efficiency is critical. PyGraphviz excels in creating high-quality static visualizations and is a good fit when presentation-quality graph outputs are required. Each library has strengths, so your choice should be guided by the graph's size, required functionality, and the desired output.
How can I handle evolving graphs or dynamic networks in Python over time?
Handling dynamic networks, where nodes and edges change over time, requires careful tracking of graph states. Python graph libraries such as NetworkX allow for the modification of graphs by adding or removing nodes and edges as data changes. For large-scale dynamic graphs, using incremental algorithms that update only the changed portions of the graph can optimize performance. You may also need to create snapshots of the graph at various points in time to analyze how the structure evolves. This time-series graph analysis can be visualized using tools like Tom Sawyer Perspectives, which can help users explore changes interactively and in real-time.
How can I benchmark the performance of different graph algorithms in Python for large datasets?
Benchmarking the performance of graph algorithms on large datasets requires a combination of techniques to evaluate efficiency in terms of time complexity and memory usage. Python's timeit module can help measure execution time, while memory profiling tools like memory_profiler can track memory consumption. Libraries like Graph-tool, optimized for large-scale graph analysis, generally outperform NetworkX on large datasets due to their C++ core. You can also use parallel computing frameworks like Dask to test how algorithms perform when distributed across multiple CPUs. Benchmarking allows you to choose the most efficient algorithm based on your specific dataset and computational resources.
How can I use graph-based metrics to evaluate the effectiveness of my analysis?
Graph-based metrics such as centrality, clustering coefficient, and modularity are essential for evaluating the effectiveness of your graph analysis. Centrality measures (degree, betweenness, and closeness) help identify key nodes in the network, while clustering coefficients reveal how tightly-knit groups of nodes are. Modularity can be used to assess the quality of community detection algorithms by measuring the strength of division into clusters. These metrics, supported by libraries like NetworkX and Graph-tool, provide quantifiable insights into the structure and behavior of the graph, helping you validate the accuracy and relevance of your analysis.
How do I handle graph data that evolves over multiple time periods in Python?
When dealing with temporal graph data, where relationships change over time, it’s essential to use time-series graph analysis. Python libraries like NetworkX can represent evolving graphs by creating time-stamped edges or snapshots of the graph at different intervals. Techniques such as dynamic graph creation or layered graphs can also help capture the changes over time. You can then analyze the evolving patterns using temporal metrics like dynamic centrality or track node and edge evolution. Visualization tools, such as Tom Sawyer Perspectives, can provide interactive insights into these time-varying relationships, making it easier to detect trends or events over multiple periods.
Submit a Comment