
Caroline Scharf
Vice President of Operations
What is a Social Graph Visualization?
Social graph visualization is a potent tool for modern businesses that allows them to map and analyze relationships within social networks. At its core, it transforms raw social data into a visual, easy-to-understand format, showcasing how individuals or entities interconnect and interact. This graphical representation is not just about creating visually appealing diagrams; it's about revealing the underlying social fabric, enabling businesses to identify and analyze patterns, trends, and influencers within their networks.
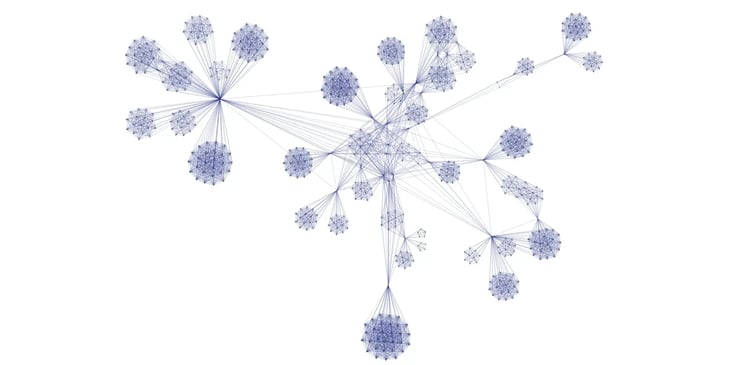
A social network diagram illustrating the relationships between individuals.
Importance of Visualizing Social Graphs for Businesses
For businesses, the visualization of social graphs is invaluable. It offers a multifaceted view of the social landscape in which they operate, enabling them to identify key influencers, understand customer relationships, and tailor marketing and engagement strategies accordingly. By leveraging social graph visualization, companies can enhance their decision-making process, improve customer engagement, and ultimately drive growth by harnessing the power of their network data.
Understanding the Data
The foundation of social graph visualization lies in the data that represents the myriad connections and interactions within a network. To effectively visualize these social structures, it's essential to understand the types of data involved, their sources, and the steps needed to prepare the data for analysis.
Types of Data to be Visualized
Social graph visualization encompasses a range of data types that reflect the diverse nature of social interactions and relationships:
- User Connections: These are the fundamental elements of a social graph, representing the direct relationships between individuals or entities, such as friendships, followings, or professional connections.
- Interactions: Beyond mere connections, interactions such as likes, comments, shares, and messages provide depth to the social graph, illustrating the strength and nature of relationships.
- Demographics: Information like age, location, occupation, and interests helps to contextualize the nodes within the social graph, offering insights into the characteristics and preferences of individuals or groups.
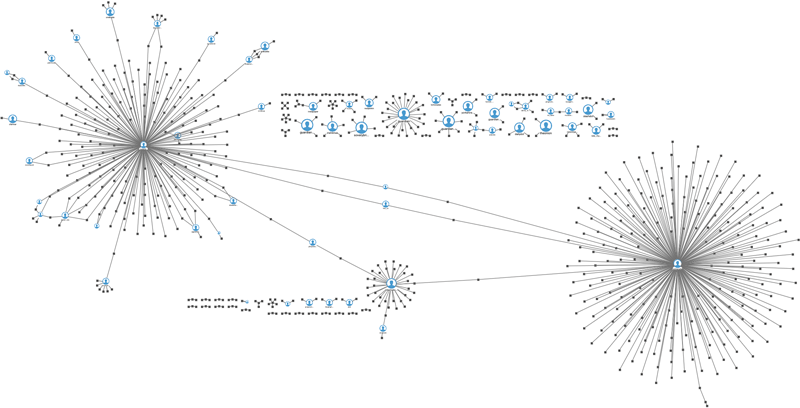
A graph visualizing showing the origin of a tweet and how it went a viral.
Data Sources
The richness of a social graph depends on the variety and reliability of its data sources. Common sources include:
- Social Media Platforms: Sites like Facebook, Twitter, LinkedIn, and Instagram are treasure troves of social data, offering extensive insights into user behaviors and interactions.
- CRM Systems: Customer relationship management (CRM) systems provide valuable data on customer interactions, preferences, and history, which can be integrated into social graphs to understand customer networks and relationships.
- Internal Data Repositories: Companies often have their own databases or data lakes that contain historical interaction data, sales records, and other internal metrics that can be visualized to understand internal and external social networks.
Data Preprocessing Steps
Before data can be effectively visualized, it must undergo several preprocessing steps to ensure its quality and usability:
- Cleaning: This involves removing irrelevant, incomplete, or erroneous data to prevent inaccuracies in the visualization.
- Normalization: Data from different sources may follow different formats or scales, so normalization standardizes this information to ensure consistency across the graph.
- Integration: Combining data from multiple sources into a cohesive set is crucial for creating a comprehensive social graph that accurately represents the network.
Understanding and preparing the data is a critical first step in social graph visualization. By ensuring the data is comprehensive, accurate, and well-structured, businesses can create meaningful visualizations that accurately reflect the social dynamics of their networks.
Choosing the Right Tools and Technologies
Selecting the appropriate tools and technologies is pivotal in social graph visualization, as these choices directly impact the ability to analyze and interpret social network data effectively. This section covers popular tools used in social graph visualization, key considerations when choosing a tool, and the importance of integration with data analytics platforms.
Overview of Popular Social Graph Visualization Tools
Several tools stand out for their effectiveness in creating detailed and interactive social graph visualizations:
- Gephi: Known for its powerful visualization capabilities, Gephi stands out for network analysis tasks. It offers various layout algorithms and metrics for exploring social networks' intricacies, making it a favorite among researchers and analysts.
- Cytoscape: Preferred in scientific circles, Cytoscape excels in complex network visualizations and data integration. Its robust platform is ideal for understanding biological and social networks, providing valuable insights for researchers.
- D3.js: For those requiring custom web-based visualizations, D3.js offers extensive libraries for dynamic, interactive graphs. It caters to advanced users with specific visualization needs, allowing for highly customized visuals embedded in web applications.
- Tom Sawyer Perspectives: Known for its advanced graph layout and support for complex visualization requirements, Perspectives offers a platform for federating and integrating data and building custom visualization and analysis applications or incorporating visualization into an existing application. It provides advanced graph analysis algorithms and chart and map views, making it ideal for social network visualization and analysis.
Each tool brings its strengths to the table, catering to different user preferences and project requirements in social graph visualization. While Gephi and Cytoscape excel in robust analysis and visualization, D3.js and Tom Sawyer Software Perspectives offer customization for tailored solutions. Understanding each tool's unique features and strengths help users choose the right fit for their graph visualization and analysis needs.
Considerations for Choosing the Right Tool
Selecting the most suitable tool depends on several factors:
- Data Size and Complexity: Larger and more complex datasets require tools with strong processing capabilities and efficient data handling.
- Visualization Needs: The choice of tool also hinges on the desired output, whether it’s static or dynamic visualizations, the level of detail needed, and specific layout or aesthetic preferences.
- User Experience: Tools vary in their ease of use. Some are designed for users with advanced technical skills, while others are more user-friendly and suitable for beginners.
Integration with Data Analytics and Business Intelligence Platforms
Integrating social and keyword graph visualization with data analytics and business intelligence (BI) platforms can significantly enhance the decision-making processes and overall business strategy. This integration enables a more comprehensive analysis by combining the granular insights from graph visualizations with broader business data, leading to more informed and nuanced business decisions.
Enhancing Data Comprehensiveness
- Unified Data View: Integrating graph visualizations with BI platforms consolidates disparate data sources, providing a holistic view of business operations and market dynamics. This unified approach helps identify correlations between social or keyword trends and business outcomes, such as sales performance or customer engagement.
- Real-time Data Analysis: Many BI platforms offer real-time analytics, which, when combined with social and keyword graph visualizations, can provide up-to-the-minute insights into market trends, consumer behavior, and network dynamics. This timely information is crucial for rapid response to market changes.
Improving Strategic Decision-Making
- Cross-functional Insights: By integrating with BI platforms, graph visualizations can be enriched with data from various business functions, such as sales, marketing, customer service, and finance, offering a multi-dimensional view of the business landscape and enabling more strategic decision-making.
- Predictive Analytics: BI platforms often include predictive analytics capabilities. When combined with the detailed network analysis from graph visualizations, businesses can forecast future trends, identify potential growth areas, and anticipate market shifts, allowing for proactive strategy adjustments.
Streamlining Operations
- Workflow Automation: Integration facilitates data flow automation between systems, reducing manual data handling and ensuring that the visualizations are always up-to-date with the latest business data.
- Actionable Insights: The combination of detailed graph analytics with comprehensive business intelligence can highlight actionable insights, guiding businesses in optimizing operations, enhancing customer experiences, and improving product offerings.
Technical Considerations
- Data Compatibility: It is crucial to ensure that the data from graph visualizations is compatible with BI platforms. This might involve standardizing data formats, establishing consistent data transfer protocols, and setting up regular data synchronization.
- Platform Interoperability: Choosing visualization and BI tools designed for interoperability can simplify the integration process, providing built-in connectors or APIs that facilitate seamless data exchange and functionality.
Designing the Visualization
Creating an effective social graph visualization involves careful consideration of layout, visual elements, and interactivity to ensure the final graph is both informative and accessible. This section discusses the key aspects of designing a social graph.
Selecting the Appropriate Layout Algorithm
The layout of a social graph significantly influences its readability and the ease with which insights can be gleaned:
- Force-directed layouts are popular for social graphs as they naturally position nodes based on their connections, creating an intuitive representation of the network’s structure.
- Circular layouts might be used to emphasize cyclical patterns or to represent networks where centrality or radial distance from a core node is important.
- Hierarchical layouts can effectively visualize structured networks, such as organizational hierarchies or layered community structures.
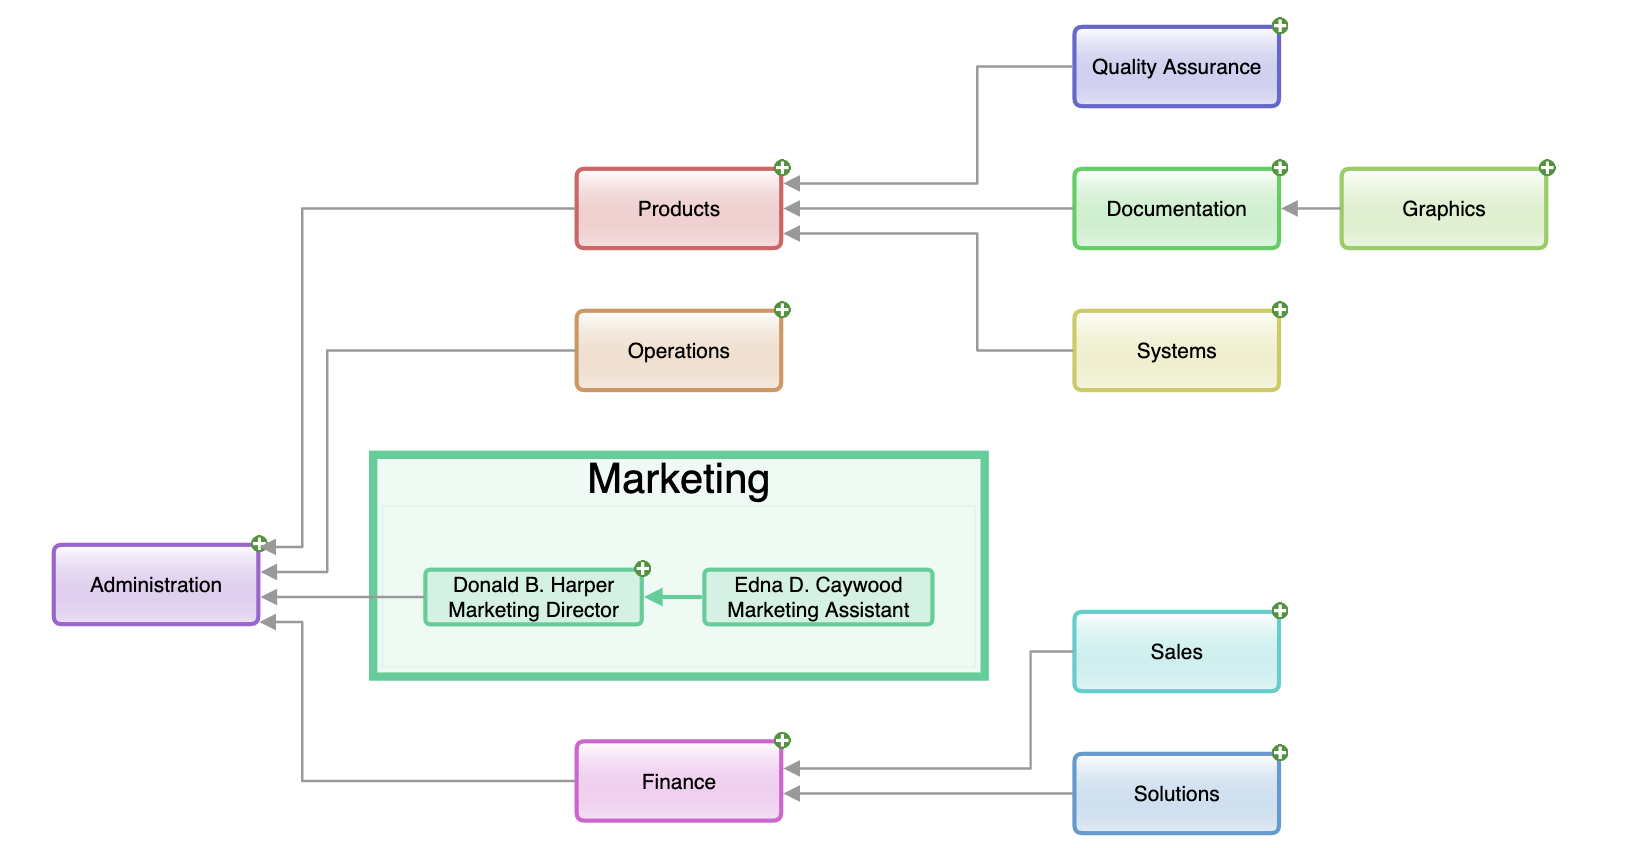
An organizational network visualized with hierarchical layout.
Customizing Visual Elements
The customization of nodes, edges, and other visual elements plays a crucial role in conveying the correct information:
- Node Size and Color: This can be used to represent different attributes or metrics, such as an individual's influence or activity level within the network.
- Edge Thickness and Style: Variations in these elements can indicate the strength or type of relationships, such as frequent interactions or weak connections.
Adding Interactive Features
Interactivity enhances the user experience, allowing for a deeper exploration of the graph:
- Tooltips provide additional information about nodes and edges on hover, offering context without cluttering the main visualization.
- Filtering and Search Functions enable users to focus on specific parts of the graph or to locate particular nodes and connections.
- Zooming and Panning capabilities allow for navigating large or complex graphs more effectively.
Interpretation and Analysis
Once a social graph is visualized, the next critical step is interpreting and analyzing the data to extract actionable insights. This phase involves identifying key elements within the graph, understanding the underlying trends and patterns, and applying advanced analytical methods to deepen the analysis.
Identifying Key Insights from the Visualization
Key insights from social graph visualizations can emerge in various forms:
- Clusters of Users might indicate communities or groups with shared interests or characteristics, providing opportunities for targeted marketing or community engagement strategies.
- Influential Nodes, often represented by their centrality or prominence in the network, can highlight important individuals or entities that could play a pivotal role in information dissemination or decision-making processes.
Analyzing Trends and Patterns
Beyond identifying key nodes and clusters, analyzing the overall structure and dynamics of the network is crucial:
- Community Detection helps in understanding how the network is segmented, which can be instrumental in devising segmented strategies for communication or product development.
- Centrality Measures such as degree, betweenness, and closeness centrality offer insights into the roles of individual nodes in the network, indicating their influence, connectivity, and control over information flow.
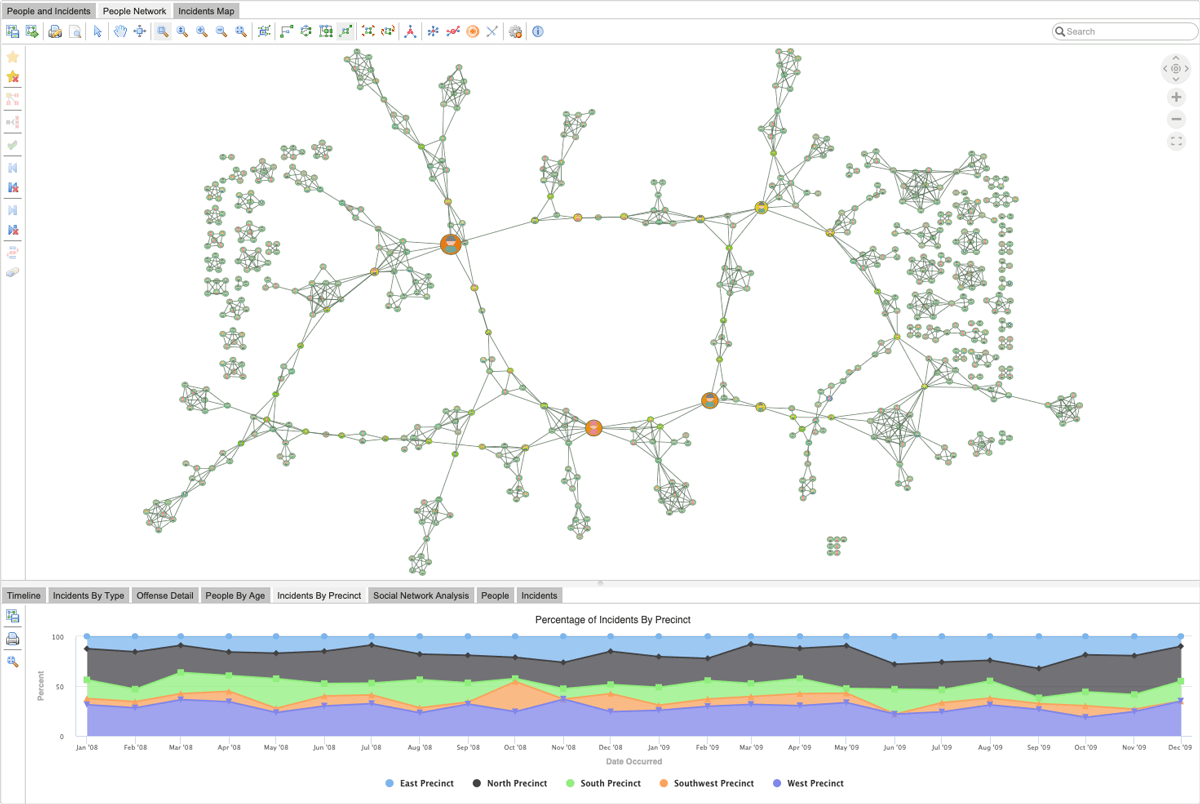
A graph visualization with betweenness centrality analysis highlights the key individuals in a network.
Incorporating Machine Learning and AI for Advanced Analysis
Leveraging machine learning (ML) and artificial intelligence (AI) can significantly enhance the analysis of social graphs:
- Sentiment analysis of communication within the network can provide insights into general sentiment or opinion trends, which is valuable for reputation management and marketing.
- Predictive Modeling can forecast trends or behaviors in the network, such as predicting potential market shifts or identifying emerging influencers.
Practical Applications
Social graph visualization is not just an analytical exercise; it has tangible, actionable applications across various business domains. Understanding how to apply insights from social graphs can improve strategies in marketing, customer relationship management (CRM), and product development.
Improving Marketing Strategies
Social graph visualization can dramatically refine marketing efforts:
- Targeting Influencers: By identifying key influencers within the network, businesses can strategize influencer marketing campaigns, leveraging these individuals' reach and authority.
- Identifying Potential Customers: Analyzing social clusters and connections can help pinpoint potential customer segments that are more likely to engage with the brand or product.
Enhancing Customer Relationship Management
In CRM, social graphs provide a deeper understanding of customer networks and behaviors:
- Understanding Customer Networks: Visualizing the social connections between customers can reveal insights into customer referral patterns and influence networks, aiding in referral marketing and loyalty program strategies.
- Detecting Churn Risk: Analyzing social interactions and connections can help identify customers at risk of churn, enabling proactive engagement to retain them.
Optimizing Product Development
Social graph analysis can also inform product development processes:
- Gathering Feedback: By monitoring and analyzing the conversations and interactions related to a product within the network, companies can gather valuable feedback and insights for product improvement.
- Analyzing User Behavior: Understanding how different user segments interact with the product or service can lead to more targeted and effective product development strategies.
Keyword Graph Visualization
Conversely, keyword graph visualization maps out the relationships between words and phrases, primarily used in SEO and content strategy. It helps in understanding how different terms are associated with each other, reflecting user search behaviors and content relevancy. Its features are:
- Nodes are keywords or phrases, showing how they are contextually related or co-occur in search queries or content.
- Edges represent the association or semantic connections between these terms, indicating how often they are used together or how they contribute to a topic or theme.
- The goal is to inform content and SEO strategies, aid in identifying trending topics, optimize content for search engines, and enhance content relevance to target audiences.
Integrating Social and Keyword Graph Visualizations
Understanding the differences and interconnections between social and keyword graph visualizations is crucial for leveraging both complementary strategies. While they serve distinct purposes, their integration can provide a comprehensive view of the digital landscape.
While social graph visualization offers insights into the structure and quality of relationships in a network, keyword graph visualization provides a lens into thematic and contextual relationships in content and search data. Integrating both can lead to a more holistic understanding of digital interactions, enabling businesses to align their social networking strategies with content and SEO efforts effectively.
Social Graph Visualization Real-World Examples
Illustrating the practical application of social graph visualization through real-world examples from diverse industries can highlight the use of social graph visualization in various contexts:
- A retail company might use social graph analysis to understand customer purchase behaviors and social influences, leading to more targeted marketing campaigns.
- In the technology sector, a firm could employ social graph visualization to map the collaboration networks within its organization, identifying key connectors and collaboration hubs to optimize team dynamics and project management.
Emerging Technologies in Social Graph Visualization
Advancements in technology are set to further transform the realm of social graph visualization:
- Augmented Reality (AR) and Virtual Reality (VR): These technologies could offer immersive ways to explore and interact with social graphs, providing a more intuitive understanding of complex networks.
- Network Analysis Tools: Enhanced tools are being developed that offer more sophisticated analyses, such as dynamic visualization of real-time data and more advanced predictive analytics capabilities.
Ethical Considerations
As social graph visualization becomes more prevalent and powerful, ethical concerns must be addressed:
- Data Privacy: As an increasing amount of personal data is visualized, it is crucial to ensure that privacy is maintained and that data usage complies with legal standards like GDPR.
- Transparency: There should be clarity about how social data is collected, analyzed, and used, especially when it comes to influencing decision-making processes in businesses or public policies.
Recommendations for Staying Updated and Leveraging New Advancements
To remain competitive and effective in utilizing social graph visualization and keyword graph visualization, businesses and professionals should:
- Engage in Continuous Learning: Attend webinars, workshops, and industry conferences to stay informed about the latest trends and technologies in graph visualization. Subscribe to relevant journals, blogs, and newsletters that focus on data science and graph analytics.
- Utilize Advanced Tools and Platforms: Invest in sophisticated graph visualization software like Tom Sawyer Perspectives, which continually updates its features to incorporate the latest advancements in graph analysis and visualization technology.
- Network with Industry Experts: Connect with professionals and experts in graph analysis and visualization through networking events, online forums, and social media groups. Sharing insights and experiences can provide valuable knowledge and keep you updated on industry best practices.
- Participate in Training Programs: Enroll in training sessions or certification courses to enhance your skills in using modern graph visualization tools and techniques. Continuous skill development ensures that you can effectively leverage the full capabilities of these tools.
- Implement Best Practices: Adopt the best practices in data visualization and graph analysis within your organization. This includes ensuring data quality, choosing the right visualization techniques, and continuously evaluating the effectiveness of your graph visualizations.
- Explore Collaboration Opportunities: Collaborate with academic institutions, research organizations, and other businesses to explore innovative uses of social and keyword graph visualization. Collaborative projects can lead to new insights and advancements in the field.
- Monitor Competitor Activities: Keep an eye on how competitors and industry leaders are using graph visualization. Understanding their approaches can provide insights into new trends and technologies that could be beneficial for your organization.
- Experiment and Innovate: Encourage a culture of innovation within your organization where team members can experiment with new data sources, visualization techniques, and analysis methods. Innovation is key to discovering new ways to leverage graph visualization for business insights.
Social graph visualization is more than a technical exercise; it is a strategic asset for businesses. It offers profound insights into the dynamics of social networks, enabling organizations to identify key influencers, understand customer behaviors, and tailor their strategies to meet the nuanced demands of their audience. The ability to visualize and analyze these social connections can lead to more informed decisions, enhanced customer engagements, and, ultimately, business growth.
About the Author
Caroline Scharf, VP of Operations at Tom Sawyer Software, has 15 years experience with Tom Sawyer Software in the graph visualization and analysis space, and more than 25 years leadership experience at large and small software companies. She has a passion for process and policy in streamlining operations, a solution-oriented approach to problem solving, and is a strong advocate of continuous evaluation and improvement.
FAQ
What are the best practices for optimizing performance when visualizing very large social graphs?
To optimize performance for large social graphs, consider using techniques such as graph sampling, aggregation of nodes, or edge bundling. Implementing lazy loading for large datasets and leveraging GPU-accelerated rendering tools can also help maintain visualization responsiveness.
What are the implications of graph sparsity and density on social graph analysis?
Graph sparsity (few connections relative to the number of nodes) and density (many connections relative to the number of nodes) significantly impact both the visualization and analysis of social graphs. Sparse graphs may require techniques to highlight significant relationships, while dense graphs might need filtering or aggregation to avoid clutter and enhance readability.
How can I visualize changes in social networks over time using version control or graph diff tools?
Advanced users can use version control techniques for graphs, akin to Git for code, to track changes in the network structure over time. Graph diff tools allow for the visualization of differences between graph versions, making it easier to understand how a network has evolved.
What are the advantages of using a hybrid approach combining static and dynamic social graph visualizations?
A hybrid approach combining static and dynamic visualizations allows for a detailed examination of network snapshots and an understanding network evolution over time. Static visualizations are useful for in-depth analysis, while dynamic ones provide insights into how relationships change and develop.
How do you apply graph theory metrics in social graph visualizations, like modularity or clustering coefficients?
Graph theory metrics such as modularity and clustering coefficients can be used to analyze the structure of social networks, identify communities, and understand the cohesiveness of groups within the network. Visualizing these metrics alongside the graph helps in interpreting complex social structures and identifying key subgroups.
Submit a Comment