
Max Chagoya
What is Link Chart Software?
Link chart software, at its core, is designed to transform raw data into visual representations that illustrate the relationships and hierarchies within the data. This transformation allows for a more intuitive understanding of complex structures, making it invaluable for network analysis, where understanding the interconnectivity of elements is key.
The software operates by mapping out entities as nodes and the relationships between them as links, creating a network or graph that visually depicts how different elements are interconnected. This method is particularly effective for analyzing social networks, organizational structures, communication patterns, and any other scenario where relational dynamics are critical.
Advancements in data visualization technology and the growing demand for more sophisticated analysis tools have significantly impacted the evolution of visualization software. Initially simple, offering basic visualizations, link chart software has evolved to support a variety of complex graph types, including directed graphs, undirected graphs, and hierarchical structures. This evolution reflects the increasing complexity of the networks being analyzed and the need for more dynamic and interactive visualization tools.
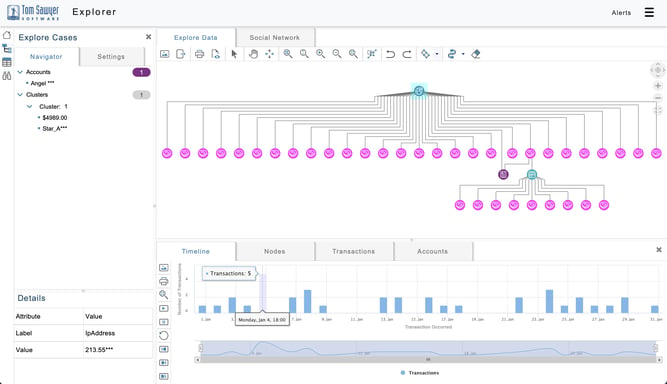
An informative network graph visualization of a timeline of transactions.
Core Features
There are several key features that set link chart software apart and make it a crucial tool for data visualization and analysis. These features are designed to accommodate the complexities of modern data sets and provide users with powerful, yet user-friendly, analytical capabilities.
- Data Integration: A key strength of link chart software is its ability to integrate and harmonize data from various sources. Whether dealing with structured databases or unstructured text files, it can amalgamate disparate data into a cohesive visual format. This integration facilitates a comprehensive view of the data landscape, allowing analysts to draw insights from a unified dataset.
- Dynamic Visualization: At the heart of this software is its dynamic visualization capability. Users can create a range of graph types, from simple node-link diagrams to complex hierarchical structures, to best represent their data. These visualizations are not static; they can be manipulated and interacted with, enabling users to explore the data in depth and uncover layers of relationships and patterns.
- Customization and Flexibility: Understanding that each dataset and analytical need is unique, link chart software offers extensive customization options. Users can adjust everything, from the visual appearance of nodes and links to the layout of the entire network graph. This flexibility ensures that the final visualization is not only informative but also tailored to the specific narrative of the data.
- Analytical Tools: Beyond basic visualization, it provides a suite of analytical tools that enables users to perform detailed network analysis. Features like pathfinding, network centrality measures, and clustering algorithms help users analyze the structural properties of the network and identify significant patterns or anomalies.
- Interactivity and Collaboration: Modern link chart software is designed to be highly interactive, with features that allow users to zoom, pan, and filter the network graph to examine different aspects of the data. Furthermore, collaboration features enable multiple users to work on the same graph simultaneously, fostering a more integrated approach to data analysis.
- Scalability: With the increasing volume of data being analyzed, link chart software is built to scale. It can handle large data sets efficiently, ensuring that the visualization and analysis processes remain smooth and responsive, even as the data grows.
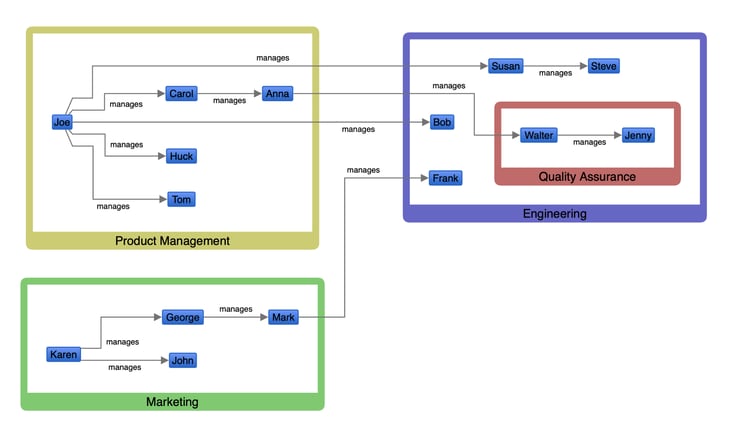
- Visualization of the hierarchical structure of an organization.
Key Benefits of Using Link Chart Software
- Enhanced Analytical Insight: Link chart software excels at transforming complex datasets into clear, comprehensible visual formats, thereby enhancing analytical insight. This enhanced perspective allows analysts to detect hidden patterns, trends, and anomalies within the data, which might be overlooked in traditional analysis methods. Its visual nature helps simplify the complexity of data, making it easier to communicate and understand intricate network relationships.
- Streamlined Decision-Making Process: By providing a visual representation of relationships and hierarchies, it plays a crucial role in streamlining the decision-making process. Decision-makers can quickly grasp the intricacies of data relationships, leading to faster and more informed decisions. This is particularly beneficial in environments where timely and accurate decisions are critical, such as in financial markets or emergency response planning.
- Collaborative Data Exploration: Link chart software often includes features that facilitate collaboration among team members, allowing for shared data exploration and analysis. This collaborative approach not only enhances the depth of analysis but also ensures that different perspectives are considered, leading to more comprehensive and well-rounded insights.
- Cost and Time Efficiency: Automating the process of data visualization and analysis with link chart software significantly reduces the time and resources spent on these tasks. Organizations can allocate their resources more efficiently, focusing on strategy and innovation rather than manual data processing. The efficiency brought by this software can lead to considerable cost savings, especially in large-scale or long-term projects.
- Adaptability to Various Industries: Link chart software's versatility is evident in its wide range of applications across different industries. From law enforcement agencies mapping criminal networks to healthcare providers analyzing patient data, it adapts to the specific needs of each field, proving its value as a multifaceted tool in data analysis.
Applications of Link Chart Software in Different Industries
Link chart software has proven to be a game-changer in various industries, with its ability to visualize and analyze complex networks of data. Here are some real-world applications and success stories:
Law Enforcement and Criminal Analysis
When it comes to law enforcement this software is instrumental in criminal investigations and intelligence analysis. It helps in mapping out the networks of relationships among suspects, victims, and other entities, revealing the structure of criminal organizations and their activities. This visual approach enables investigators to identify key individuals, understand hierarchical relationships, and uncover hidden connections, thereby aiding in crime prevention and prosecution efforts.
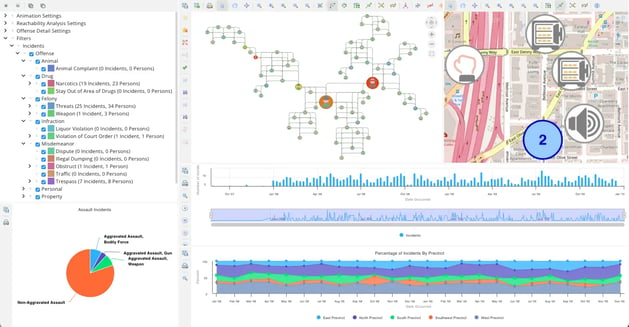
A crime network graph visualization.
Business Intelligence and Market Research
Businesses leverage link chart software to gain insights into market dynamics, customer behavior, and competitive landscapes. In market research it visualizes the connections between consumer preferences, product categories, and brand interactions, helping companies to strategize their marketing efforts and product development. It facilitates the identification of market trends and potential areas for growth or investment, driving data-driven decision-making in the business sector.
Healthcare and Medical Research
In healthcare, link chart software is used to analyze patient data, track disease outbreaks, and manage healthcare delivery. By visualizing patient histories, treatment patterns, and outcomes, medical professionals can improve care plans and patient management strategies. In medical research, it aids in understanding the relationships between various biological entities and disease mechanisms, contributing to advancements in medical knowledge and treatment approaches.
Telecommunications Network Management
Telecommunications companies utilize link chart software to manage and optimize their networks. It helps visualize the network architecture, monitor traffic flow, and identify bottlenecks or failure points. This information is crucial for maintaining network performance, planning expansions or upgrades, and ensuring reliable service delivery to customers.
Fraud Detection in Financial Services
Financial institutions employ this software to detect and prevent fraudulent activities. Through the visualization of transaction networks, analysts can spot unusual patterns that may indicate fraudulent behavior. This capability has helped banks and financial services companies save millions of dollars by preventing fraud before it could cause significant financial damage.
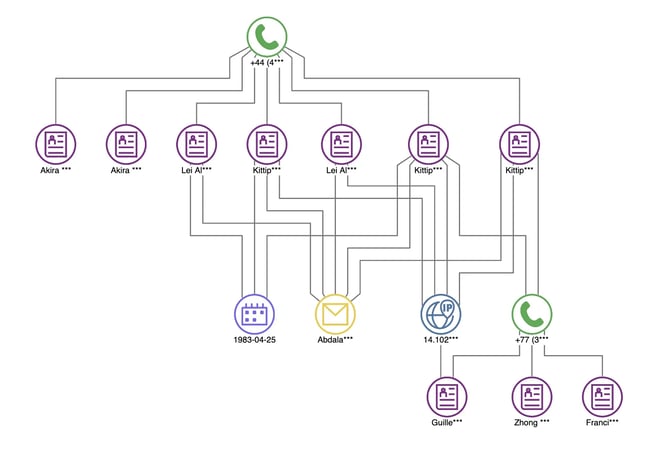
A graph visualization of fraud alerts.
Advanced Features and Customization of Link Chart Software
Link chart software is not just about basic network diagrams; it offers a suite of advanced features that cater to the intricate needs of data analysts and researchers. These features enhance the software's utility, making it a powerful tool for in-depth data exploration and analysis.
Advanced Analytical Functions
- Predictive Modeling: Some visualization tools incorporate predictive analytics, using historical data to forecast future trends and behaviors within networks.
- Pattern Recognition: Advanced algorithms help identify recurring patterns and anomalies within the data, aiding in the detection of potential issues or opportunities.
- Social Network Analysis (SNA): This feature allows for the examination of social structures through the use of network and graph theories, identifying key influencers, information flow, and community structures.
Customization Capabilities
- Visual Customization: Users can tailor the aesthetics of their charts, modifying colors, shapes, and sizes to represent different data attributes or to align with organizational branding.
- Interactive Dashboards: Customizable dashboards enable users to interact with the data, drill down into specific areas, and generate personalized reports, enhancing the user experience and the value derived from the software.
Integration and Scalability
- Data Source Integration: Link chart software often supports integration with various data sources, including databases, spreadsheets, and even live data feeds, ensuring a comprehensive data analysis platform.
- Scalable Infrastructure: As organizational data grows, the software can scale to manage increased data loads, maintaining performance and reliability without compromising on speed or accuracy.
Integration with Other Systems
The ability to integrate with other systems is a critical feature that significantly enhances its utility and effectiveness. This integration facilitates a seamless data flow between different platforms and tools, enabling a more comprehensive and holistic approach to data analysis.
Seamless Data Connectivity
Link chart software can connect with a variety of data sources, including relational databases, cloud storage solutions, and API-driven data services. This connectivity allows for real-time data updates and ensures that the visualizations are always based on the most current information available, which is crucial for timely decision-making.
Compatibility with Business Intelligence Tools
Many link chart solutions are designed to work in tandem with broader business intelligence (BI) platforms. This compatibility enables organizations to incorporate network visualization into their overall data analysis framework, enhancing the depth and breadth of insights that can be derived from their data.
Custom API Integration
Advanced link software often provides custom API integration capabilities, allowing organizations to tailor the software to their specific operational needs. This level of integration supports the automation of data workflows, streamlining the process of data collection, analysis, and visualization.
Scalability and Flexibility
Integration is not just about data; it's also about scaling to meet the demands of growing organizations. Link software that integrates well with other systems can scale more effectively, handling increased data loads and more complex analyses without sacrificing performance or user experience.
Security and Data Protection in Link Chart Software
With data breaches and cyber threats becoming more frequent, security features are of paramount importance. Protecting sensitive data while ensuring its availability for analysis is a critical balance that this software aims to achieve.
- Robust Data Encryption: typically it employs strong encryption protocols to secure data both in transit and at rest. This encryption ensures that unauthorized individuals cannot access or decipher the data, safeguarding it from potential breaches or leaks.
- Access Control Mechanisms: To further enhance security, it incorporates comprehensive access control mechanisms. These allow administrators to define user permissions and access levels, ensuring that individuals can only access data and functionalities relevant to their role. This minimizes the risk of insider threats and accidental data exposure.
- Compliance with Regulatory Standards: Given the increasing scrutiny on data handling and privacy, this software is designed to comply with various regulatory standards, such as GDPR, HIPAA, or CCPA. Compliance features include data anonymization, audit trails, and user activity logs, which are essential for meeting legal and ethical requirements.
- Regular Security Updates and Patch Management: Developers continuously monitor for new vulnerabilities and release updates and patches to address potential security threats. This proactive approach to security management ensures that the software remains protected against evolving cyber threats.
- Incident Response and Recovery: In the event of a security incident, link chart software provides tools for rapid response and recovery. Features like backup and restore capabilities ensure that data can be recovered following a breach, minimizing downtime and data loss.
The integration of these security and data protection features not only protects the organization's data assets but also builds trust with clients and stakeholders who are increasingly concerned about data privacy and security.
What is Multidimensional Scaling Graph Visualization?
Multidimensional scaling (MDS) graph visualization is a statistical technique used to translate complex, high-dimensional data into a visual, lower-dimensional space, often in two or three dimensions, while preserving the relative distances or dissimilarities between points in the dataset. This method allows for easier interpretation and analysis of the data by representing it in a form that can be intuitively understood and visually analyzed.
Key Aspects of MDS Visualization
- Dimensionality Reduction: MDS reduces the number of dimensions needed to represent data without significantly losing the information conveyed by the original data set. This reduction makes it possible to visualize multi-dimensional data in a 2D or 3D space.
- Preservation of Distances: It aims to preserve the distances between data points as accurately as possible. In the resulting graph, similar items are placed closer together, while dissimilar items are farther apart, reflecting the true relationships within the data.
- Exploratory Data Analysis: MDS is often used for exploratory data analysis, helping to uncover underlying patterns or structures in the data that might not be apparent in high-dimensional spaces.
- Applicability Across Fields: It is used in various fields such as psychology, marketing, biology, and social sciences to analyze similarity or dissimilarity data, and understand consumer preferences, genetic relationships, or social networks, among others.
How Multidimensional Scaling Graph Visualization Works
- Distance Matrix Computation: MDS starts with a distance matrix representing the dissimilarities between pairs of items in the dataset.
- Configuration Placement: It then calculates a configuration of points in a lower-dimensional space (usually two or three dimensions) that best preserves these distances.
- Optimization Process: The positions of points are iteratively adjusted to minimize the difference between the high-dimensional distances and the distances in the reduced-dimensional plot, often using a stress function or criterion as a measure of fit.
- Visualization and Analysis: The final output is a graph that allows one to analyze and interpret the patterns and relationships inherent in the data visually.
Multidimensional scaling graph visualization is particularly useful for visualizing the structure of the data, identifying clusters, outliers, and patterns, and simplifying complex data sets to aid in decision-making and presentation.
How Do Link Chart Software and Multidimensional Scaling Graph Visualization Interrelate?
The connection between link chart software and multidimensional scaling (MDS) graph visualization lies in their complementary capabilities for analyzing and visualizing complex data. While both are used for data visualization, they serve different yet interconnected purposes in understanding and interpreting data relationships and structures.
Enhanced Data Analysis and Visualization:
- Link chart software, integrated with MDS capabilities, can offer a more nuanced view of the data. MDS helps in distilling complex, multidimensional data into a format that is easier to visualize and interpret within a link chart, enhancing the software’s ability to reveal hidden patterns and insights.
- While link chart software excels in illustrating direct relationships and network structures, MDS adds value by allowing the visualization of indirect or less obvious relationships through spatial proximity in a reduced-dimensional space. This combination enables a more comprehensive analysis of the data.
- The integration of MDS graph visualization in link chart software can aid in better decision-making by providing a clearer, more detailed view of the data’s underlying structure. Decision-makers can understand not just the explicit connections but also the subtle relationships and groupings within the data.
- Combining MDS visualization with link chart software expands the range of applications for which data visualization can be effectively used. It allows for a broader set of data types and structures to be analyzed, from straightforward network diagrams to complex datasets with hidden multidimensional relationships.
Conclusion
Link chart software has emerged as an indispensable tool of data visualization and analysis, adept at transforming complex datasets into understandable visual networks. This capability is crucial in today's data-driven environment, where making sense of vast amounts of information quickly and accurately is key to success.
The integration of multidimensional scaling (MDS) graph visualization enhances this tool's utility, offering a richer, multi-dimensional perspective that deepens analytical insights. Such a combination not only expands the scope of analysis but also refines the decision-making process across various sectors by providing more nuanced understandings of data.
About the Author
Max Chagoya is Associate Product Manager at Tom Sawyer Software. He works closely with the Senior Product Manager performing competitive research and market analysis. He holds a PMP Certification and is highly experienced in leading teams, driving key organizational projects and tracking deliverables and milestones.
FAQ
1. How can link chart software be used for advanced fraud detection across multiple financial systems?
Link chart software can be utilized for advanced fraud detection by integrating and visualizing transaction data from multiple financial systems. It can reveal complex fraud networks through pattern recognition and anomaly detection algorithms, helping financial institutions more effectively identify and mitigate fraudulent activities.
2. What are the implications of graph theory metrics in link chart visualizations, such as betweenness centrality and modularity?
Metrics like betweenness centrality and modularity provide deeper insights into the structure of networks visualized in link chart software. Betweenness centrality helps identify critical nodes that act as bridges within the network, while modularity measures the strength of division of a network into modules or communities, revealing the network’s internal structure.
3. How can I leverage link chart software to conduct cross-domain analysis in multi-disciplinary research projects?
Link chart software can be a powerful tool for cross-domain analysis by integrating data from diverse fields (e.g., combining financial data with social network data). Advanced users can create hybrid models that visualize and analyze relationships across different domains, enabling interdisciplinary insights and discoveries.
4. How does the choice of layout algorithm impact the interpretation of complex networks in link chart visualizations?
The choice of layout algorithm (e.g., force-directed, hierarchical, circular) significantly impacts the clarity and interpretability of complex networks. Hierarchical layouts are ideal for displaying organizational structures, while force-directed layouts are better for uncovering clusters and communities within the network. Understanding when and how to apply these algorithms is crucial for accurate analysis.
5. What are the implications of network centralization and decentralization in link chart visualizations for organizational analysis?
Network centralization refers to how control and influence are concentrated within a network, while decentralization indicates a more distributed structure. In organizational analysis, visualizing these aspects can reveal power dynamics, communication bottlenecks, or the resilience of the organization’s structure, helping to inform strategies for organizational change or improvement.
6. How can I use link chart software to simulate and analyze network disruptions or failures?
Advanced users can simulate network disruptions or failures (e.g., node removal or link disruption) within link chart software to study the network’s resilience and identify critical nodes whose failure would significantly impact the network. This type of analysis is particularly useful in cybersecurity, infrastructure management, and risk assessment.
Submit a Comment