
Caroline Scharf
Vice President of Operations
What are Graph Algorithms Visualization
Graph algorithms are a set of instructions that traverse, manipulate, and analyze graph structures. These graphs consist of nodes (vertices) connected by edges (links) and can represent a wide array of real-world scenarios, such as social networks, biological networks, and transportation systems. Graph algorithm visualization plays a crucial role in understanding these complex structures and their interrelationships. By using graph algorithm visualization, we can better interpret the data and uncover hidden patterns and insights.

A graph algorithm visualization illustrating influential members of a crime network.
Types of Graph Algorithms
- Traversal Algorithms
- Depth-First Search (DFS): An algorithm that explores each branch as far as possible before backtracking. It is useful for pathfinding and maze generation.
- Breadth-First Search (BFS): An algorithm that explores all neighbor nodes at the present depth before moving on to nodes at the next depth level. It is commonly used in shortest-path algorithms and peer-to-peer networks.
- Shortest Path Algorithms
- Dijkstra's Algorithm: Finds the shortest path from a single source vertex to all other vertices in a graph with non-negative edge weights.
- Bellman-Ford Algorithm: Computes shortest paths from a single source vertex to all other vertices in a weighted digraph. It can handle graphs with negative edge weights.
- Minimum Spanning Tree Algorithms
- Kruskal's Algorithm: An algorithm that finds the minimum spanning tree for a connected weighted graph by adding increasing cost arcs, ensuring no cycles.
- Prim's Algorithm: Finds the minimum spanning tree by starting from an arbitrary node and expanding the tree by adding the cheapest edge from the tree to a new vertex.
- Network Flow Algorithms
- Ford-Fulkerson Algorithm: This algorithm computes the maximum flow in a flow network. It uses residual networks and augmenting paths.
- Edmonds-Karp Algorithm: Implementing the Ford-Fulkerson method using BFS to find augmenting paths, providing better performance guarantees.
- Graph Clustering Algorithms
- Girvan-Newman Algorithm: This algorithm detects communities in a graph by progressively removing edges with the highest betweenness centrality, which breaks down the graph into communities.
- Louvain Method: An iterative algorithm that optimizes the modularity of a partition of the network. It is known for its efficiency and scalability.
Applications of Graph Visualization Algorithms in Various Fields
Graph algorithms are extensively used in diverse fields:
- Social Network Analysis: Identifying influential nodes, detecting communities, and analyzing social dynamics. Graph algorithms help map social interactions and the spread of information.
- Biology: Mapping genetic relationships, analyzing protein-protein interactions, and studying ecological networks. For example, DFS and BFS are used to traverse biological networks.
- Logistics and Transportation: Optimizing routes, managing supply chains, and designing efficient transportation networks. The shortest path algorithms are critical for route planning.
- Computer Networks: Routing data, detecting anomalies, and enhancing network security. Network flow algorithms are used to optimize traffic and manage network resources.
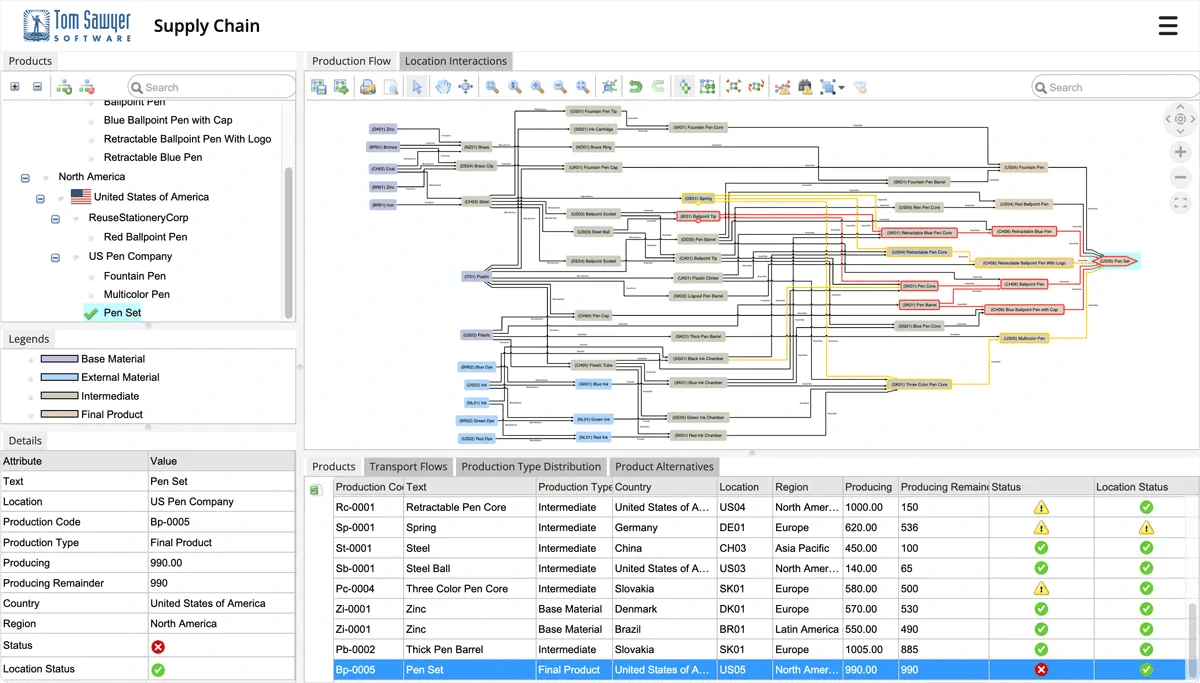
Graph visualization of a supply chain.
The Role of Visualization in Graph Algorithms
Visualization is a powerful tool in the analysis and interpretation of graph algorithms. It transforms complex data structures into visual formats that are easier to understand and analyze. Graph algorithms visualization helps in:
- Identifying Patterns: Detecting trends, clusters, and outliers within the data. Visualizing a social network, for example, can reveal communities and key influencers.
- Simplifying Complexity: Making intricate relationships and structures more comprehensible. Large datasets with numerous connections become easier to navigate and understand when visualized.
- Communicating Insights: Effectively conveying findings and analysis to stakeholders. Visual representations are often more impactful than numerical data, facilitating better communication of insights. Graph algorithms visualization enhances the ability to present complex data in a clear and concise manner.
Benefits of Visualizing Graph Algorithms
- Enhanced Understanding: Visualization facilitates better comprehension of algorithm behaviors and outcomes. It makes abstract concepts concrete, allowing for intuitive understanding. Graph algorithms visualization ensures that even non-technical stakeholders can grasp the insights derived from complex algorithms.
- Improved Decision Making: Aids in making informed decisions based on visual insights. By seeing the relationships and patterns in data, stakeholders can make better-informed choices.
- Increased Accessibility: Visualization tools can make complex data accessible to non-experts, bridging the gap between technical data and user-friendly presentations.
- Effective Debugging: Helps identify and rectify algorithm errors. Visual representations can quickly highlight anomalies and areas where the algorithm may not be performing as expected, allowing for more efficient troubleshooting and refinement.
Techniques and Approaches in Graph Algorithms Visualization
Various techniques can be employed to visualize graph algorithms effectively:
- Node-Link Diagrams
- These diagrams represent nodes as points and edges as lines connecting them. They are intuitive and widely used for simple graph visualizations.
- Node-link diagrams are beneficial for visualizing relationships and paths within the graph.
- Matrix Representations
- In matrix representations, the graph is displayed as a matrix where rows and columns represent nodes, and cell values indicate the presence of edges.
- This technique is particularly useful for dense graphs and can reveal patterns not easily seen in node-link diagrams.
- Hypergraphs
- Hypergraphs generalize the concept of graphs by allowing edges to connect multiple nodes. They are useful for representing complex relationships.
- Hypergraphs are employed in areas like database theory and bioinformatics.
Recent advancements have introduced innovative approaches to graph algorithm visualization:
- Interactive Visualizations
- Interactive visualizations allow users to explore and manipulate the graph dynamically. Techniques include zooming, panning, and filtering.
- Interactive visualizations enhance user engagement and provide deeper insights.
- Real-Time Updates and Animations
- Visualizations that update in real-time and include animations help in understanding the dynamic behavior of graph algorithms.
- These approaches are valuable in applications like network monitoring and real-time data analysis.
- Graph-Based Clustering and Data Visualization Algorithms
- Clustering algorithms group nodes based on their connections, revealing community structures within the graph.
- Data visualization algorithms help in presenting large datasets in a comprehensible manner, making use of graph structures.
Common Graph Visualization Algorithms
Force-Directed Algorithms
Force-directed algorithms, such as the Fruchterman-Reingold and Kamada-Kawai algorithms, model the graph as a physical system. Nodes are treated as objects with repulsive forces, and edges act as springs with attractive forces. The algorithm iteratively adjusts the positions of nodes to minimize the overall energy, leading to an aesthetically pleasing layout. Graph algorithms visualization often employs force-directed algorithms to create intuitive and visually appealing representations.
Applications and Examples:
- Social Networks: Visualizing connections and communities. Force-directed layouts can reveal the underlying structure of the network, highlighting clusters and central nodes. This is a common approach in graph algorithms visualization for social data.
- Biological Networks: Displaying relationships between genes or proteins. These algorithms help visualize complex interactions in a way that highlights key functional modules, making them invaluable in biological graph algorithm visualization.
- Software Engineering: Representing dependencies in software components. By visualizing software dependencies, developers can better understand and manage the complexity of their codebases.
Layered Graph Drawing Algorithms
Layered graph drawing algorithms, like Sugiyama's framework, are used for directed acyclic graphs. These algorithms assign nodes to discrete layers, minimizing edge crossings and producing a hierarchical layout. Graph algorithms' visualization greatly benefits from layered layouts in presenting hierarchical structures clearly.
Use Cases and Benefits:
- Flowcharts: Representing workflows and processes. Layered layouts make it easy to follow the flow of processes step by step.
- Hierarchical Data: Visualizing organizational structures and taxonomies. They are ideal for displaying data that has a clear parent-child relationship, which is often a focus in graph algorithms visualization for organizational data.
- Dependency Graphs: Displaying dependencies in project management. By visualizing tasks and their dependencies, project managers can effectively plan and allocate resources.
Circular Layout Algorithms
Circular layout algorithms position nodes on a circle, with edges drawn as chords. This layout is particularly useful for visualizing dense graphs, as it reduces edge crossings and highlights symmetrical structures. Circular layouts are a unique approach in graph algorithms visualization that can make complex networks easier to understand.
Advantages in Specific Scenarios:
- Social Networks: Highlighting central nodes and community structures. Circular layouts can effectively show how peripheral nodes are connected to central figures, enhancing the effectiveness of graph algorithm visualization in social network analysis.
- Genomic Data: This layout represents relationships in circular genomes. It is well-suited for visualizing the circular nature of certain types of genomic data, making it a popular choice in biological graph algorithms visualization.
- Telecommunication Networks: Visualizing connections in ring networks. Circular layouts can represent the ring structure of many telecommunication networks, making it easier to understand and manage.

A large circular graph layout.
Advanced Graph Drawing Algorithms for Visualization
Hierarchical Layout Algorithms
Hierarchical layout algorithms are designed to visualize hierarchical data structures. These algorithms place nodes in hierarchical levels, maintaining the parent-child relationships. Examples include the Reingold-Tilford algorithm, which produces compact, readable tree layouts. In the context of graph algorithms visualization, hierarchical layouts are particularly useful for displaying structured data clearly and effectively.
Applications in Hierarchical Data Structures:
- Organizational Charts: Visualizing company structures. Hierarchical layouts are perfect for showing the relationships between different levels of management and departments.
- File Systems: Displaying directory hierarchies. These layouts can represent the nested structure of directories and files, making it easier to navigate large file systems.
- Decision Trees: Representing decision-making processes. By visualizing decision trees, analysts can better understand and communicate the flow of decision-making processes.
Multi-Dimensional Scaling (MDS)
Multi-Dimensional Scaling (MDS) is a technique that translates high-dimensional data into low-dimensional representations, typically 2D or 3D. It preserves the distance between points as accurately as possible, making it easier to visualize complex data. Graph algorithms visualization often utilizes MDS to provide a more intuitive understanding of high-dimensional relationships.
Use in Visualizing High-Dimensional Data:
- Gene Expression Data: MDS visualizes similarities and differences in gene expression profiles. It can help identify patterns and clusters within high-dimensional biological data.
- Market Segmentation: Displaying customer segments in marketing analysis. By reducing the dimensionality of customer data, MDS makes it easier to identify distinct market segments.
- Sensor Networks: Representing spatial relationships between sensors. MDS can visualize the physical layout and interactions of sensors in a network, aiding in the design and management of sensor systems.
Graph-Based Clustering and Data Visualization Algorithms
What is Graph-Based Clustering
Graph-based clustering involves partitioning a graph into clusters or communities. This approach leverages the structure of the graph to group nodes that are more densely connected to each other than to the rest of the graph. Graph algorithms visualization plays a crucial role in understanding and interpreting these clusters by visually representing the grouped data.
Algorithms for Graph-Based Clustering
- Girvan-Newman Algorithm: The Girvan-Newman algorithm detects communities by progressively removing edges with the highest betweenness centrality, eventually isolating clusters. This method is effective in identifying tightly-knit groups within larger networks.
- Louvain Method: The Louvain method is an iterative algorithm that optimizes modularity, a measure of the density of edges within communities compared to edges between communities. It is known for its efficiency and scalability, making it suitable for large networks.
Data Visualization Techniques Using Graph-Based Clustering
Graph-based clustering enhances data visualization by:
- Highlighting Communities: Making it easier to identify and analyze subgroups within networks. Clustering algorithms can reveal the natural divisions within the data, helping to focus on key areas. Graph algorithms visualization can effectively display these communities, making the data more comprehensible.
- Simplifying Complex Networks: Focusing on clusters rather than individual nodes reduces clutter. Visualizing clusters makes it easier to understand the overall structure of the network.
- Enhancing Interpretability: Grouping related nodes together improves the readability of visualizations. This makes it easier to interpret the data and draw meaningful conclusions. The use of graph algorithms and visualization techniques ensures that the clustered data is presented in an intuitive and accessible manner.
Tools and Libraries for Graph Algorithms Visualization
Gephi
Gephi is open-source network analysis and visualization software. It supports various layouts and provides powerful tools for graph manipulation and analysis, making it a robust choice for visualization of graph algorithms. Features include:
- Interactive Visualization: Allows users to interact with the graph in real-time, adjusting layouts and exploring data.
- Supports Large Networks: Capable of handling large datasets efficiently.
- Extensive Plugins: Offers a wide range of plugins to extend functionality.
Cytoscape
Cytoscape is a software platform specifically designed for biological network visualization. It offers extensive customization options and integration with various data sources, enhancing its utility in graph algorithms visualization for biological data. Features include:
- Specializes in Biological Data: Tailored for visualizing biological networks, with features that support common biological data formats.
- Integration with Biological Databases: Easily integrates with various biological databases for seamless data import.
- Advanced Analysis Tools: Provides tools for complex network analysis, including clustering and pathway analysis.
Graphviz
Graphviz is a versatile tool for creating structured graphics. It supports numerous layout algorithms and is highly adaptable to different graph visualization needs, making it a valuable tool in graph algorithms visualization across various fields. Features include:
- Text-Based Graph Descriptions: Uses a text-based language (DOT) for graph descriptions, making it easy to script and automate graph creation.
- Wide Range of Layout Algorithms: Supports hierarchical, radial, and other layout styles.
- Suitable for Automated Graph Generation: Ideal for generating graphs programmatically in various applications.
Tom Sawyer Perspectives
Tom Sawyer Perspectives is an advanced tool for graph and data visualization. It offers comprehensive features for building sophisticated visualization applications, making it particularly effective for complex data analysis. Its integration capabilities and performance optimization are key strengths in graph algorithms visualization. Features include:
- Advanced Visualization and Layout Capabilities: Supports sophisticated visualizations and graph layout for complex data structures including connectors, labels, nesting, and bundle, circular, hierarchical, orthogonal and symmetric layout styles.
- High Performance: Optimized for handling large and complex graphs efficiently.
- Integration Flexibility: Easily integrates with various data sources and systems, enhancing its utility in diverse applications.
- Customizable Interface: Offers extensive customization options for creating tailored visualization applications.
By understanding the unique features and capabilities of these tools, you can select the most appropriate one for your specific graph algorithm visualization needs, ensuring effective and efficient data analysis and representation.

An advanced graph algorithm visualization produced with Tom Sawyer Perspectives illustrating connectors, labels and orthogonal layout.
How to Choose the Right Tool for Your Needs
When choosing a graph visualization tool, consider:
- Data Type: Match the tool to the type of data (e.g., biological, social). Different tools offer specialized features for different types of data. For instance, Gephi is versatile, while Cytoscape excels in graph algorithms visualization for biological networks.
- Scalability: Ensure the tool can handle the size of your network. Tools like Gephi are designed to manage large datasets efficiently, making them ideal for graph algorithms visualization in large-scale projects.
- Customization: Look for tools that offer the flexibility you need. Cytoscape, for instance, offers extensive customization options for biological data.
- Integration: Consider how well the tool integrates with your existing workflows and data sources. Tools that support seamless integration with databases and other software can save time and effort.
Challenges and Best Practices
Visualizing graph algorithms comes with several challenges:
Data Complexity
- Large and complex graphs can be difficult to visualize effectively. The sheer volume of data can lead to cluttered and unreadable visualizations. Graph algorithms visualization needs to address this complexity by using advanced techniques to simplify and clarify the data.
Rendering Performance
- Rendering large graphs requires significant computational power. Ensuring smooth performance while maintaining interactivity is a challenge. Techniques like applying algorithms in Neo4j visualization can optimize the rendering process, enhancing performance.
User Interface Design
- Designing an intuitive and user-friendly interface for graph visualizations is crucial. Poor design can hinder user understanding and interaction. Graph algorithms visualization should prioritize usability to ensure that users can easily navigate and interpret the visualizations.
To overcome these challenges, consider the following best practices:
Simplify the Visualization
- Use techniques like clustering and filtering to reduce complexity. Highlight important nodes and edges to focus user attention. Simplification is key in graph algorithms visualization to make complex data more manageable and understandable. This is especially important when visualizing complex algorithms, where clarity and focus are essential.
Optimize Performance
- Implement efficient algorithms and data structures to handle large graphs. Utilize hardware acceleration and parallel processing where possible. Optimizing performance is essential for ensuring that graph algorithms visualization remains interactive and responsive.
Design for Usability
- Ensure the user interface is intuitive and easy to navigate. Provide clear labels, legends, and tooltips to aid user understanding. User-friendly design is critical in graph algorithms visualization to facilitate effective data exploration and analysis.
Leverage Graph-Based Clustering and Data Visualization Algorithms
- Use clustering algorithms to group related nodes, making the graph more comprehensible. Apply data visualization algorithms to present the data in a meaningful way. Leveraging these techniques enhances the effectiveness of graph algorithms visualization by making the data more interpretable and actionable.
Conclusion
Graph algorithms and their visualization are indispensable tools in data analysis, offering profound insights into complex relationships and structures. By understanding and leveraging various graph algorithms visualization techniques, we can enhance our ability to analyze, interpret, and communicate data effectively.
About the Author
Caroline Scharf, VP of Operations at Tom Sawyer Software, has 15 years experience with Tom Sawyer Software in the graph visualization and analysis space, and more than 25 years leadership experience at large and small software companies. She has a passion for process and policy in streamlining operations, a solution-oriented approach to problem solving, and is a strong advocate of continuous evaluation and improvement.
FAQ
How do real-time graph visualizations help in fields like cybersecurity or financial markets?
Real-time graph visualizations allow for the dynamic monitoring of network changes, making them critical in fields where quick decision-making is essential. In cybersecurity, for example, real-time graphs can track network traffic, instantly identifying anomalies that might indicate a security breach, such as unusual data flows or connections. In financial markets, these visualizations can monitor transactions, track stock prices, and reveal sudden market trends or liquidity shifts. By offering an immediate, visual representation of large, complex datasets, real-time graph visualizations help analysts and decision-makers quickly spot issues and take corrective actions, improving response times and reducing risks.
How do graph visualizations handle weighted edges, and why are they important?
In many real-world applications, not all connections between nodes carry the same significance. Weighted edges in graph visualizations represent these differences, with edge weights typically indicating a relationship's strength, cost, or frequency. For instance, in social network analysis, a heavier weight might signify stronger interactions or more frequent communications between individuals. Visual cues like varying line thickness or color intensity can easily interpret these weights, allowing users to quickly identify the most influential relationships or critical connections in the dataset. Visualizing and understanding weighted edges is key to deriving actionable insights from complex networks, whether in transportation, biology, or communication systems.
How do visualizations assist in comparing different graph algorithms for the same dataset?
Graph visualizations are invaluable when comparing multiple algorithms applied to the same dataset. For instance, when evaluating shortest-path algorithms like Dijkstra's and Bellman-Ford's, visualizing the paths they generate helps users see differences in efficiency or performance under varying conditions, such as graphs with negative edge weights. Similarly, clustering algorithms like Louvain and Girvan-Newman can reveal different community structures within the same network. However, visualizing the clusters side by side highlights the differences in how these algorithms group nodes. This visual comparison provides clarity, making choosing the most appropriate algorithm based on the specific dataset or problem requirements easier, especially when dealing with large or complex data.
What are some common pitfalls to avoid when designing graph visualizations?
Poorly designed graph visualizations can obscure important data rather than reveal it. Common pitfalls include over-cluttering the graph with too many nodes or edges, leading to visual overload where key insights are lost in complexity. Another frequent issue is inappropriate layouts—for example, using a force-directed layout for hierarchical data might create confusion rather than clarity. Additionally, failing to provide interactivity, such as zooming, filtering, or panning, can limit the user’s ability to explore the graph effectively, especially in large datasets. To avoid these issues, it's essential to simplify visualizations through clustering, use appropriate layouts based on the data type, and ensure that interactive features are included for improved user experience and deeper insights.
How do graph visualization tools ensure scalability when dealing with millions of nodes and edges?
Scalability is a major challenge in graph visualization, particularly when working with massive datasets that contain millions of nodes and edges. Tools designed for scalability use advanced techniques to ensure that performance remains efficient and visual clarity is maintained. One common approach is hierarchical clustering, where related nodes are grouped, reducing the overall complexity of the visualized graph. Edge bundling techniques can also reduce the visual clutter caused by crossing edges. Furthermore, zoomable user interfaces allow users to focus on specific areas of the graph, scaling from a high-level overview to detailed views without losing performance. Many tools also implement algorithms optimized for parallel processing or hardware acceleration, ensuring smooth interaction even with vast amounts of data. Scalability is crucial in fields like social network analysis, biology, and telecommunication, where the sheer size of the graph can easily overwhelm standard visualization approaches.
Submit a Comment