
Liana Kiff
What are Knowledge Graph Visualization Tools
Knowledge Graph Visualization Tools emerge as a critical aspect in the data-driven landscape. These tools support a paradigm shift in how we comprehend and manipulate large volumes of information.
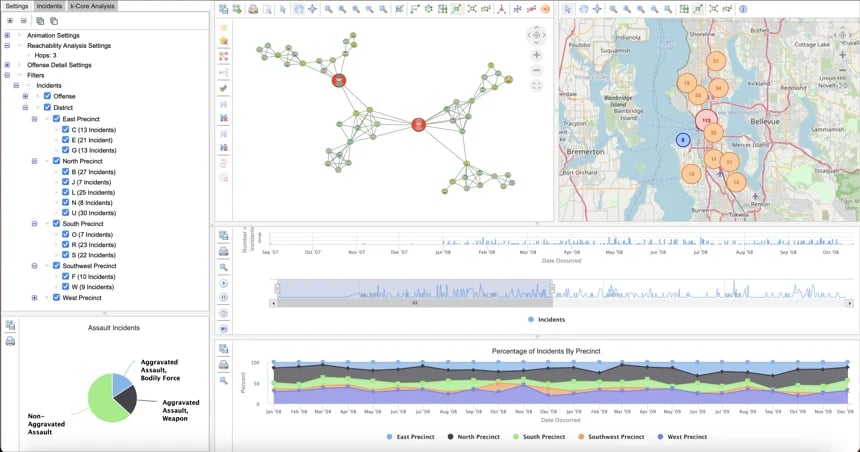
An example knowledge graph visualization application.
At its core, a Knowledge Graph is a flexible, intelligent way of organizing and interpreting data. It connects discrete pieces of information in a way that not only highlights individual data points but also their interrelations. This method of data representation transcends traditional linear data analysis, offering a more dynamic, interconnected web of knowledge. As a result, these visualization tools are becoming an indispensable asset in various fields, from academic research to business intelligence.
But why is this shift important? In a world inundated with data, the challenge lies not just in collecting information but in making sense of it. Knowledge Graph Visualization Tools address this challenge head-on. They allow us to visualize data networks, revealing patterns and insights that might be invisible in traditional data formats. This visual representation is not just about aesthetics; it’s about creating a more intuitive and comprehensive understanding of complex information sets.
The use of these tools extends beyond mere data representation. They are an integral part of data interpretation and analysis, aiding in uncovering hidden connections and insights. In industries where strategic decisions rely heavily on data, such as finance, healthcare, and marketing, these tools can be the difference between a good decision and a great one.
Importance of Knowledge Graph Visualization Tools in Data Interpretation and Analysis
Knowledge graph visualization tools have proven to be invaluable when comes to data analysis. They represent a significant leap forward from traditional data interpretation methods, offering a multi-dimensional view of data sets that enhances understanding and decision-making.
The cornerstone of these tools is their ability to reveal hidden patterns and connections within data. In a traditional spreadsheet, data is static and isolated, and can lack the context required for accurate interpretation. In contrast, knowledge graphs illustrate how data points are interrelated, providing a comprehensive picture. This interconnected approach is crucial in complex data environments where understanding the relationship between different data points can lead to groundbreaking insights.
Moreover, these tools democratize data analysis. They transform complex, raw data into visual, understandable formats. This visualization makes data accessible to professionals across various domains, not just data scientists. For instance, marketing teams can leverage these tools to understand consumer behavior patterns, while healthcare professionals can use them for patient data analysis, leading to better healthcare outcomes.
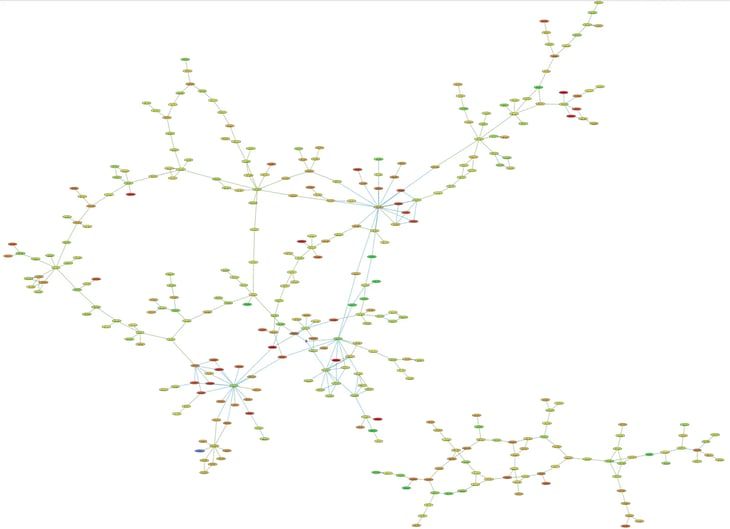
A large knowledge graph revealing patterns in data.
Another significant aspect is the speed of analysis. Knowledge graph visualization tools can process and display complex data sets rapidly, enabling real-time data analysis. This feature is particularly vital in scenarios where timely information is crucial, such as in financial markets or emergency response situations.
Furthermore, these tools aid in predictive analysis. By analyzing historical data and current trends, they can forecast future patterns, empowering businesses and researchers to be proactive rather than reactive. This predictive capability is essential in areas like market analysis, where understanding future trends can give a competitive edge.
Fundamentals of Knowledge Graphs
Defining Knowledge Graphs: Core Concepts and Structure
Knowledge graphs represent a transformative approach to data management and utilization. At their core, these graphs are networks of interconnected data points, where each node represents a unique entity (such as a person, place, or concept), and the links depict the relationships between them. This structure allows for a more holistic and relational view of data, contrasting sharply with traditional, table-based data representations.
One of the key strengths of knowledge graphs is their flexibility. They are not confined by rigid schemas and can evolve as new data is added. This adaptability makes them incredibly efficient for integrating diverse data sources, which is a common requirement in today's interconnected digital ecosystem.
The structure of a knowledge graph is also inherently semantic, meaning it's designed to not only store data but also understand its context and significance. This semantic understanding is pivotal in tasks like information retrieval, natural language processing, and machine learning, where the meaning and relationships between data points are crucial.
Importance in Data Representation: Advantages over Traditional Models
The shift to knowledge graphs from traditional data models offers numerous advantages. Firstly, they provide a more natural way to represent complex, real-world scenarios. Traditional models often require data to be forced into predefined categories, leading to a loss of nuance and context. Knowledge graphs, with their flexible structure, preserve the richness and multidimensionality of data.
Moreover, knowledge graphs enhance the discoverability and accessibility of information. By visualizing connections between data points, they make it easier to uncover insights that might be hidden in a more linear, tabular data format. This aspect is particularly valuable in exploratory data analysis, where understanding the broader context of data is essential.
Additionally, knowledge graphs facilitate better data integration. In a world where data comes in various formats and from disparate sources, knowledge graphs act as a unifying platform, allowing for more seamless and meaningful data amalgamation.
Key Features of Knowledge Graph Visualization Tools
Interactive User Interface: Design and Navigation Features
The effectiveness of Knowledge Graph Visualization Tools largely hinges on their user interface. An intuitive, interactive user interface is crucial for navigating complex data sets effortlessly. These tools often feature drag-and-drop functionalities, customizable dashboards, and easy-to-use navigation panels, making them accessible even to those with limited technical expertise. The design prioritizes user experience, ensuring that information is not just accessible but also comprehensible and engaging.
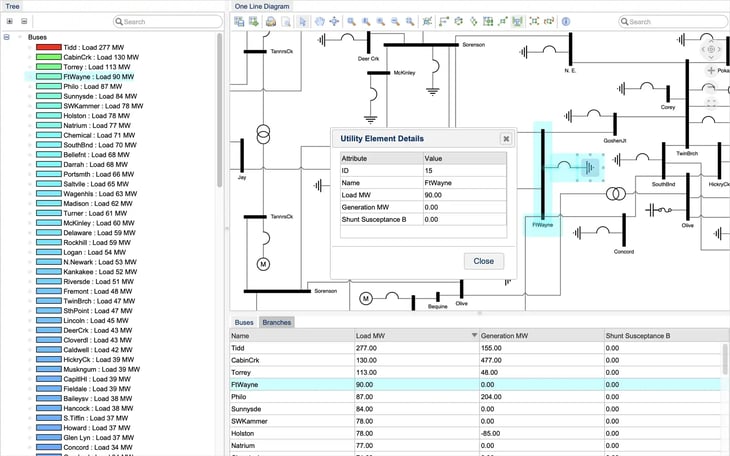
An example interactive knowledge graph visualization tool.
Data Integration Capabilities: Supporting Various Data Formats
A key feature of these tools is their robust data integration capabilities. They can handle a wide array of data formats, from structured databases to unstructured text. This versatility is critical in today’s data landscape, where data comes in diverse forms. Integration capabilities also extend to real-time data processing, allowing users to incorporate and analyze live data feeds, an essential feature for dynamic, up-to-date data analysis.
Visualization Techniques: Graph-based Data Representation
The heart of these tools lies in their advanced visualization techniques. They transform complex data sets into clear, visually appealing graphs. These representations are not just aesthetic enhancements; they make the data more understandable and actionable. Users can see patterns, trends, and relationships in a single glance, facilitating quicker and more informed decision-making.
Graph visualizations can be customized to specific use cases. A graph visualization does not have to be a one-to-one match to the underlying graph. Different users can get different graph visualizations from the same knowledge graph to address specific tasks or analysis, providing the context and perspective that they need.
Furthermore, graph visualization tools can help to manage complexity. Graphs are frequently made up of sub-graphs, and these subgraphs can be collapsed to effectively reduce data overload, while still supporting ease of navigation in the visualization.
Analytical Tools and Reporting: Embedded Analytics and Custom Reports
Embedded analytical tools are another standout feature. Users can perform complex data analysis within the platform, from trend analysis to predictive modeling. The tools often include customizable reporting features, allowing users to generate tailored reports that highlight specific data insights, catering to varied organizational needs.
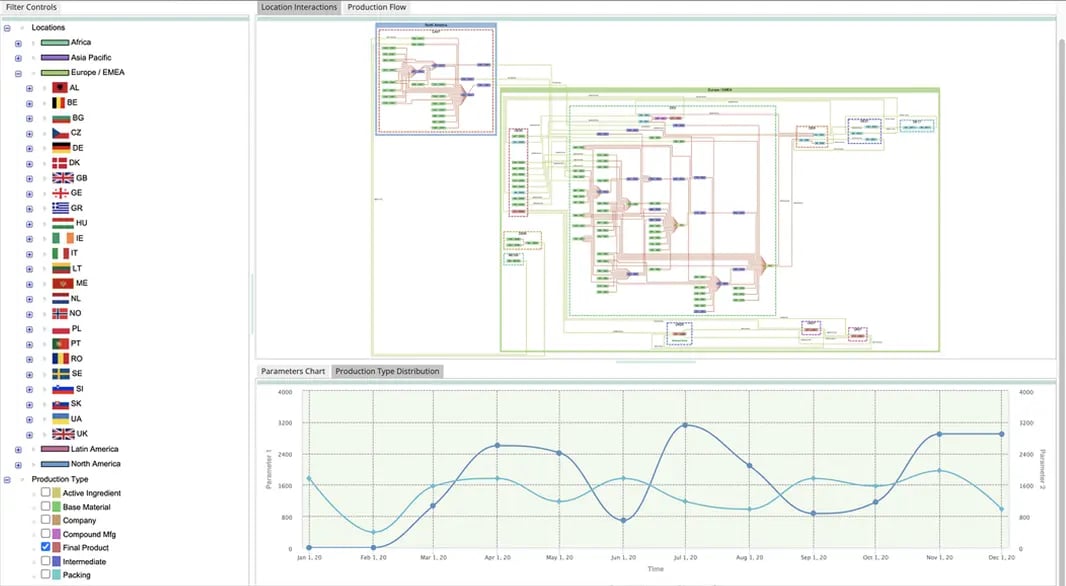
A knowledge graph application showing analysis of a supply chain.
Collaboration Features: Multi-user Access and Sharing
Collaboration is pivotal in data analysis, and these tools support this through multi-user access and sharing capabilities. Teams can work on the same data sets, share insights, and make collaborative decisions. This feature is particularly valuable in cross-functional projects, where input from diverse departments enhances the quality of analysis.
Application Scenarios for Knowledge Graph Visualization Tools
Business Intelligence and Market Analysis
Knowledge Graph Visualization Tools are revolutionizing the field of business intelligence, providing companies with unparalleled capabilities to decipher complex market data and consumer behavior patterns. This holistic approach is invaluable for strategic planning, as it allows businesses to identify trends, gaps in the market, and potential growth areas. By integrating data from various sources, these tools aid in crafting nuanced market analysis and informed business strategies, enhancing decision-making processes.
Academic Research and Collaboration
The academic sector benefits immensely from these tools, especially in fields where research involves vast amounts of data. Knowledge graphs aid in visualizing relationships between different research elements, making it easier to draw conclusions and spot trends. They also promote collaborative research, as they allow for easy sharing and interpretation of data among scholars. This aspect is crucial in multidisciplinary research, where integrating diverse perspectives leads to more robust findings.
IT Infrastructure and Network Management Visualizing Complex Networks
For IT professionals, managing complex network infrastructures can be daunting. Knowledge Graph Visualization Tools provide a clear view of network components and their interconnections, simplifying troubleshooting, maintenance, and planning. They help identify potential issues, understand the impact of changes in the network, and ensure optimal performance. This visual approach to network management enhances efficiency and reduces the likelihood of costly downtime.
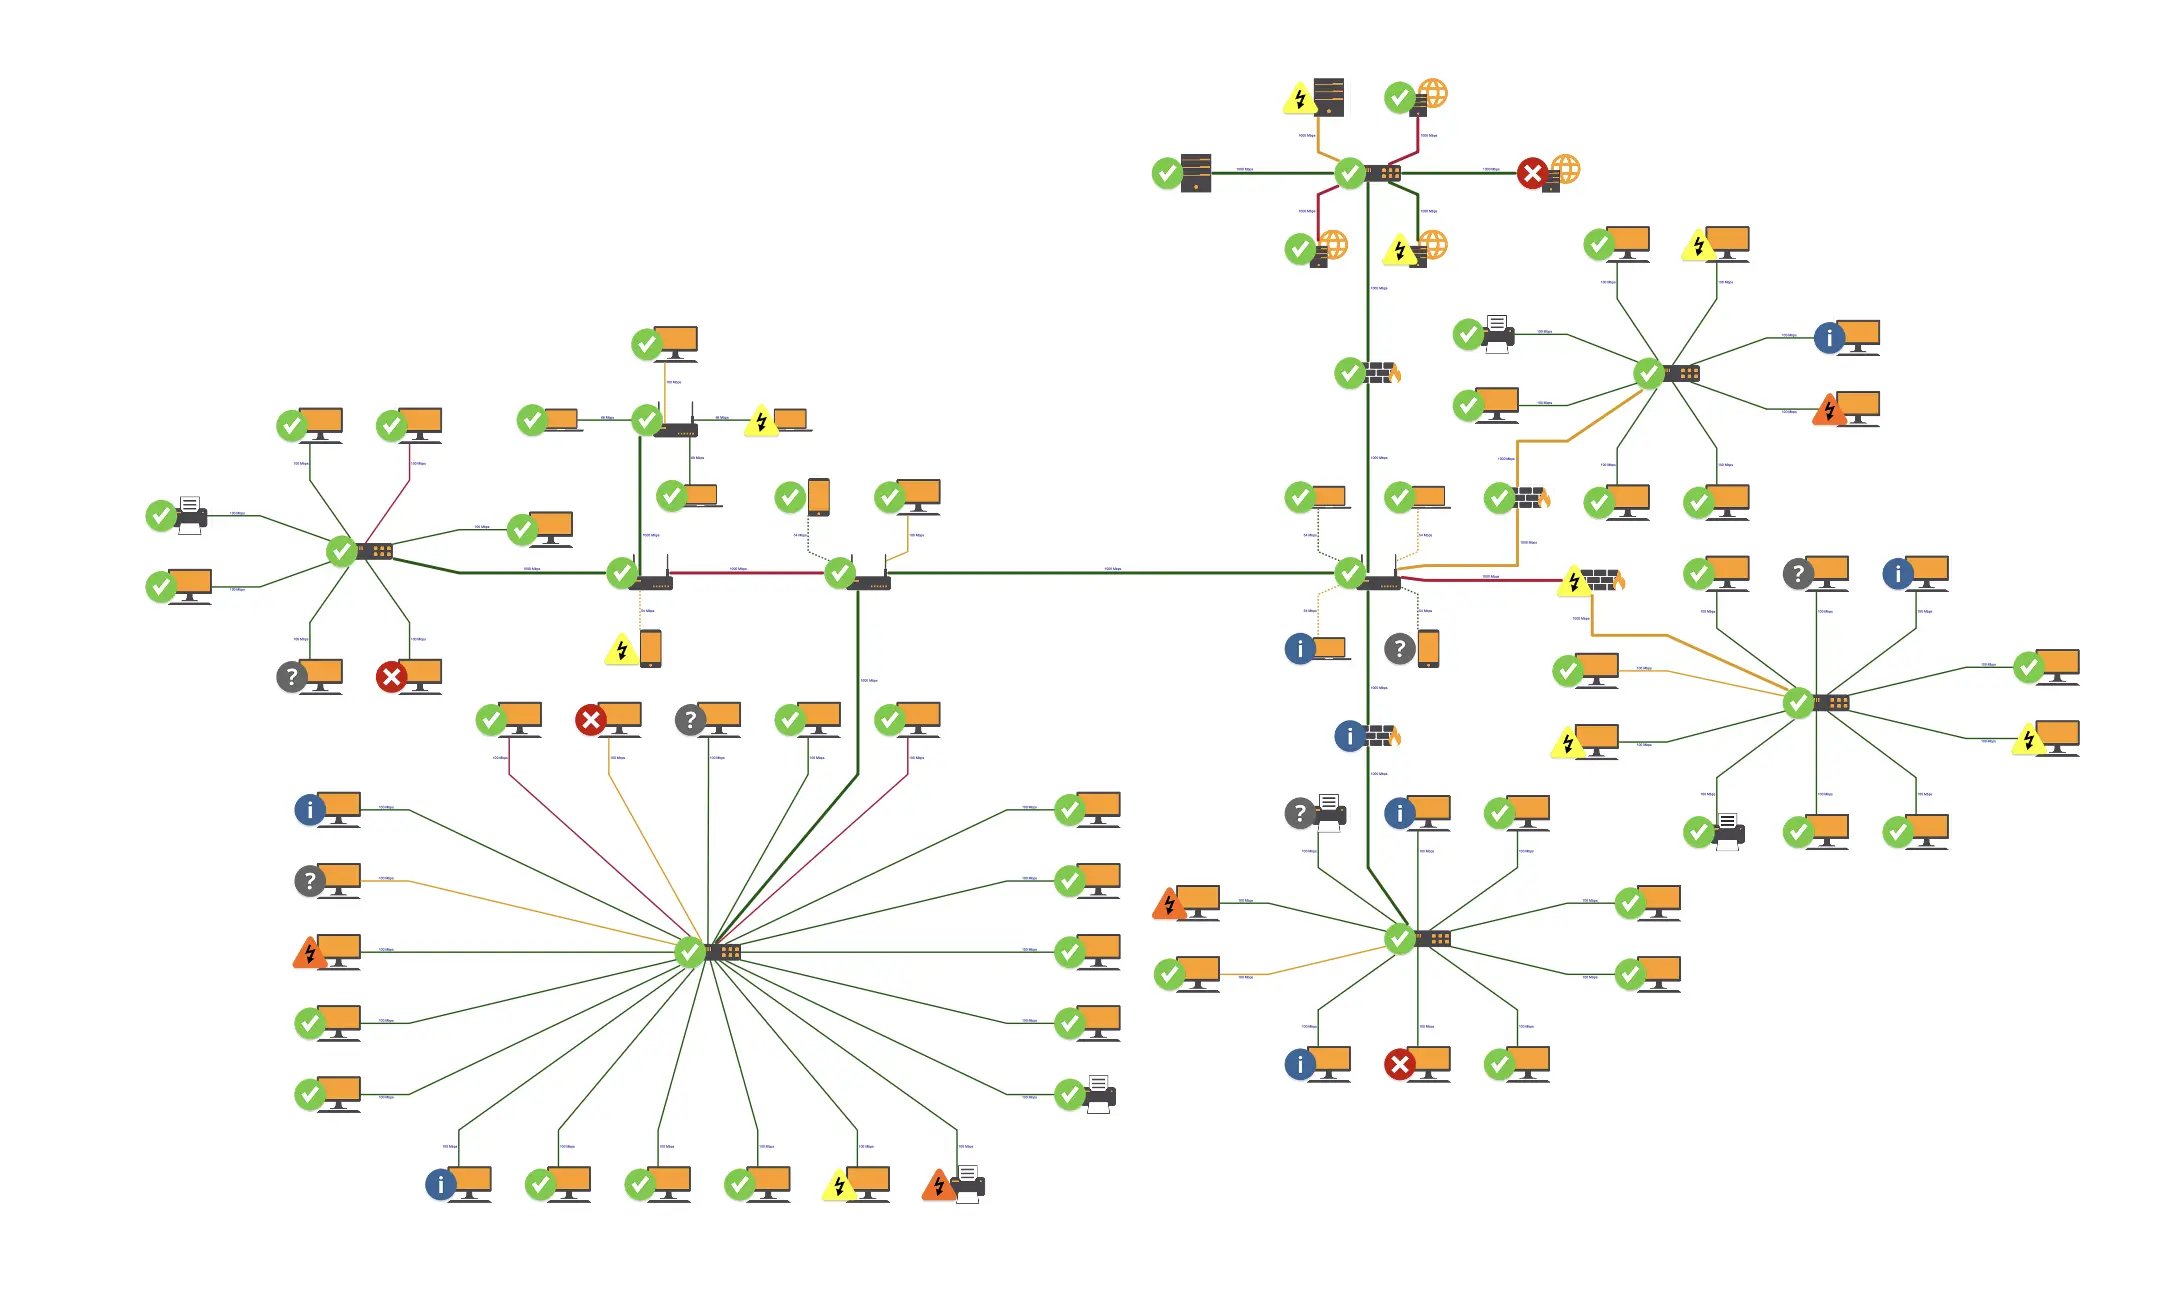
Knowledge graph visualization of an IT network.
Advantages of Utilizing Knowledge Graph Visualization Tools
Enhanced Data Understanding and Insights
One of the most significant advantages of Knowledge Graph Visualization Tools is their ability to enhance data comprehension. By representing complex data sets as interconnected networks, these tools provide a more intuitive understanding of data relationships and dependencies. This visualization leads to deeper insights, as users can identify patterns and anomalies that would be difficult to discern in traditional data presentations. Such enhanced understanding is crucial for sectors where data-driven insights can lead to breakthrough innovations or critical business decisions.
Streamlined Decision-Making Processes
In today's fast-paced business environment, the speed and accuracy of decision-making can be a competitive advantage. Knowledge Graph Visualization Tools like Tom Sawyer Perspectives streamline these processes by providing quick access to key data insights. They enable decision-makers to see the big picture and the intricate details simultaneously, leading to more informed and faster decisions. This capability is particularly beneficial in dynamic industries where being agile and responsive to market changes is essential.
Improved Data Management and Team Collaboration
These tools also revolutionize data management and team collaboration. With features that support multiple data formats and sources, they provide a unified platform for data analysis, reducing the complexities of managing disparate data systems. Collaboration features enable teams to work together effectively, regardless of their geographical location. Sharing insights and working on joint data projects becomes seamless, fostering a collaborative work environment that is essential for innovation and growth.
Challenges and Considerations in Knowledge Graph Visualization
Addressing Data Security and Privacy: Ensuring Safe Data Handling
While Knowledge Graph Visualization Tools offer numerous benefits, they also present challenges, particularly in terms of data security and privacy. As these tools often handle sensitive and vast amounts of data, ensuring the security and privacy of this data is paramount. Organizations must implement robust security protocols and comply with data protection regulations to prevent unauthorized access and data breaches. Additionally, as these tools become more integrated with various data sources, the complexity of maintaining data privacy increases, necessitating advanced security measures and continual vigilance.
Scalability and Performance Issues: Managing Large and Complex Data Sets
Another significant challenge is scalability and performance. Knowledge Graph Visualization Tools must efficiently manage large and complex data sets without compromising performance. As the volume and complexity of data grow, these tools need to scale accordingly, ensuring that data processing and visualization remain fast and reliable. This requires powerful computing resources and sophisticated algorithms to handle data-intensive operations. Organizations need to consider these factors when implementing these tools to avoid issues such as slow data processing, system crashes, or inaccurate data visualization.
Future Trends in Knowledge Graph Visualization
Integration with AI and Machine Learning: Predictive Analysis and Advanced Insights
A key future trend in knowledge graph visualization is the integration of artificial intelligence (AI) and machine learning (ML). This convergence is set to unlock new levels of predictive analysis and advanced insights. AI and ML algorithms can analyze large-scale knowledge graphs to identify patterns and trends that are beyond human capability to discern. This integration will enable more sophisticated forecasting models, enhance anomaly detection, and provide deeper insights into complex data sets. As AI and ML continue to evolve, their synergy with knowledge graph visualization will become a cornerstone for innovative data analysis strategies.
Expanding Applications Across Industries: Healthcare, Finance, and Beyond
Another significant trend is the expanding application of Knowledge Graph Visualization Tools across various industries. In healthcare, these tools can revolutionize patient care by providing comprehensive views of patient data, leading to more personalized and effective treatment plans. In finance, they can be used for risk assessment, fraud detection, and customer relationship management. Other industries, such as retail, logistics, and manufacturing, are also beginning to harness the power of these tools for various purposes, including supply chain optimization, market trend analysis, and product development. The versatility of these tools makes them adaptable to a wide range of industry-specific challenges and opportunities.
Conclusion: The Evolving Landscape of Knowledge Graph Visualization
As we have explored throughout this article, Knowledge Graph Visualization Tools are at the forefront of a significant shift in how we approach data analysis and interpretation. These tools, with their ability to provide a more intuitive, interconnected view of data, are changing the landscape of data-driven decision-making across various sectors.
From enhancing data understanding to streamlining decision-making processes and improving collaborative efforts, the benefits of these tools are manifold. They have proven to be invaluable in translating complex data sets into actionable insights, thereby empowering organizations to make more informed decisions.
However, as with any technology, there are challenges to be considered, particularly in terms of data security, privacy, and scalability. Addressing these challenges is essential for harnessing the full potential of these tools.
Looking ahead, the integration of Knowledge Graph Visualization Tools with AI and machine learning and their expanding applications across industries like healthcare, finance, and more paint a picture of a dynamic and promising future. These advancements suggest a continued evolution, where data analysis becomes not just a task of interpretation but a journey of discovery.
In conclusion, the landscape of Knowledge Graph Visualization is evolving rapidly, driven by technological advancements and a growing recognition of the value of visually intuitive and interconnected data analysis. As these tools continue to develop and integrate with other cutting-edge technologies, their impact on business, research, and everyday decision-making will only become more profound.
About the Author
Liana Kiff is a Senior Consultant, bringing more than 25 years of software innovation, design, and development experience to Tom Sawyer Software. Prior to Tom Sawyer Software, Liana worked on graph-based approaches to industrial information management at Honeywell’s corporate labs, where she acquired deep domain knowledge related to commercial, and industrial customers of advanced control solutions. As a champion of information standards and model-driven approaches, she led the development of a common ontology for use across a wide range of building automation solutions and managed the development of cloud-based services and APIs for enterprise software development. Liana holds a Master of Software Engineering degree from the University of Minnesota.
FAQ
How do Knowledge Graph Visualization Tools differ from traditional data visualization tools like charts and graphs?
Traditional data visualization tools like bar charts or pie graphs focus on presenting individual data points or metrics. In contrast, Knowledge Graph Visualization Tools emphasize the relationships between those data points, offering a multi-dimensional, interconnected view. This makes them more effective in revealing patterns, dependencies, and connections within complex datasets, especially when understanding how different elements influence each other is crucial.
How do Knowledge Graph Visualization Tools assist in detecting hidden patterns and anomalies in data?
These tools are particularly effective at identifying hidden patterns and anomalies by visualizing the data points and the relationships between them. By highlighting unusual or unexpected connections within the graph, users can detect irregularities that may indicate fraud, system vulnerabilities, or other critical issues. This capability is especially useful in fields like cybersecurity, fraud detection, and network management, where spotting anomalies quickly is crucial.
Can Knowledge Graph Visualization Tools handle unstructured data, and how?
Yes, Knowledge Graph Visualization Tools are designed to integrate and handle unstructured data, such as text, images, and videos, by converting them into nodes and relationships within the graph. These tools use natural language processing (NLP) techniques to extract meaningful information from unstructured sources, creating links between previously disconnected data points. This allows for richer, more comprehensive data analysis and insight generation, especially when dealing with complex datasets from multiple sources.
How do Knowledge Graph Visualization Tools enhance predictive analytics?
Knowledge Graph Visualization Tools enhance predictive analytics by leveraging historical data and mapping relationships between data points to identify trends and future patterns. These insights allow businesses to anticipate market movements, consumer behavior, and potential risks, giving them a competitive edge. For instance, by analyzing relationships in financial transactions, businesses can predict market shifts, or by examining customer interaction patterns, companies can forecast future product demand.
How can Knowledge Graph Visualization Tools help in optimizing supply chain management?
Knowledge Graph Visualization Tools can optimize supply chain management by mapping out complex relationships between suppliers, manufacturers, distributors, and customers. They allow businesses to visualize the entire supply chain network, identify bottlenecks, optimize routes, and predict potential disruptions. By analyzing these interconnected data points, organizations can make more informed decisions, streamline operations, and improve the overall efficiency of their supply chains.
What are the benefits of real-time collaboration features in Knowledge Graph Visualization Tools?
Real-time collaboration features allow multiple users to simultaneously access, update, and analyze the same knowledge graph, which fosters teamwork and faster decision-making. These features are particularly beneficial in large organizations or cross-functional projects, where different teams or departments need to collaborate on the same data set. This capability helps ensure that all stakeholders have access to the most current information, leading to more cohesive strategies and quicker, more informed decisions.
Submit a Comment