

Liana Kiff
Modern organizations collect enormous volumes of data, but extracting value from that data remains difficult. Individual records, events, and facts may exist across many systems, yet they do not automatically become useful knowledge. The real challenge is understanding which information matters, how it relates to other information, and what meaning can be drawn from those connections.
Knowledge graphs provide a framework to address this challenge by connecting fragmented enterprise data into a model that shows not only what information exists, but how it relates. Instead of treating records as separate facts, teams can follow how information connects, investigate the context surrounding observed patterns, and give analytical or AI-generated results a clearer factual basis.
This guide examines how knowledge graphs are used in real enterprise environments where decisions depend on connected context, from risk investigation and clinical decision support, to supply chain visibility, recommendation systems, IoT operations, and Graph RAG architectures.
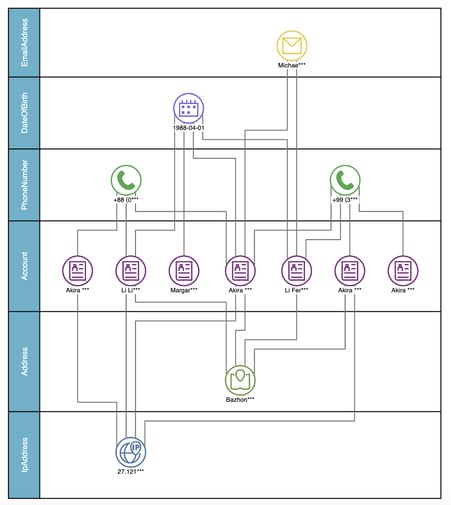
This swim-lane visualization of entities associated with a financial-fraud case uses metadata such as entity type, role, or event category to organize relationships and make the underlying network easier to interpret.
What Are Knowledge Graphs and How Are They Applied?
Knowledge graphs provide a way to represent information as a connected semantic model, rather than as separate records stored in isolated systems. At their core, they describe real-world entities and the relationships between them, so data can be interpreted in context rather than viewed solely as individual facts.
This distinction is important in enterprise environments, where the value of information often depends on the relationships around it. A transaction becomes more meaningful when it can be evaluated in relation to the account behind it, the entity involved, prior behavior, and the wider risk context. A clinical decision becomes clearer when a patient’s history can be interpreted alongside the evidence that explains which treatments worked, which risks appeared, and which options remain relevant.
Unlike traditional relational databases, which organize information into predefined tables and records, knowledge graphs represent data as interconnected entities and relationships whose meaning is explicitly defined. This semantic structure makes it easier to connect information across systems, trace dependencies that span organizational boundaries, and understand how people, assets, events, and processes influence one another within a broader operational or analytical context. One practical advantage is that knowledge graph models often evolve more naturally as new entity types and relationships emerge, reducing the amount of schema redesign that complex relational models often require.
Like more traditional databases, the practical value of a knowledge graph depends on more than the data it contains. It depends on the quality of the model, the clarity of the relationships, and the ability of analysts to explore those connections visually and analytically. When these elements are in place, knowledge graphs become a foundation for contextual reasoning, explainable analytics, and more reliable AI systems.
Why Organizations Use Knowledge Graphs
Organizations rarely adopt knowledge graphs simply because they want a new data structure. They adopt them because important business questions become difficult to answer when information is fragmented across systems. As enterprises grow, data accumulates across operational platforms, analytical environments, and specialized applications built for different purposes. Each system may perform its role effectively, but understanding how information relates across those boundaries becomes increasingly difficult.
Many enterprise knowledge graphs address this challenge by introducing a shared semantic layer that connects information without requiring every source to conform to the same structure. Rather than focusing only on individual records, teams can explore how entities, events, systems, and processes relate to one another across the organization.
This connected view allows analysts to investigate relationships that are often difficult to uncover through traditional reporting approaches. Instead of asking only what happened, they can explore why it happened, what influenced it, and what other systems, assets, or entities may be affected.
The result is not simply better data integration. It is a richer understanding of how information moves through the business, supporting more informed decisions, stronger analytical capabilities, and more reliable AI-driven workflows.
What Makes a Strong Knowledge Graph Use Case?
Not every data problem is a knowledge graph problem. A knowledge graph becomes valuable when the answer depends on relationships that are difficult to see, query, or explain through conventional data structures.
The strongest use cases usually begin with a question that crosses system boundaries. An organization may need to understand how a supplier disruption affects finished products, how a vulnerability exposes a critical asset, or how a pattern of transactions connects to a wider fraud network. In each case, the business value comes from following relationships across domains, not from analyzing one record type in isolation.
This is why knowledge graphs are especially useful in environments where context changes the meaning of the data. A cybersecurity alert, for example, has limited value until it is understood in relation to the affected asset, the user involved, the vulnerability being exploited, and the possible path to a high-value system. A supplier record becomes more useful when it can be interpreted in terms of upstream dependencies, regional exposure, certification status, and downstream product impact.
Many strong knowledge graph use cases also benefit from explainability. Knowledge graphs preserve relationships and provenance that applications can use to show the evidence or traversal path supporting an answer. That path is important when analysts need to explain why a risk was identified, why a recommendation was made, or how one event may affect another part of the organization.
A practical test is whether the workflow depends on multi-hop traversal, relationship-aware inference, or combining context across several degrees of connection. If the team needs to move across several degrees of connection, apply business context to those connections, and explain the result to another stakeholder, a knowledge graph may be an appropriate architectural choice. The strongest use cases are the ones where information becomes more valuable when its relationships are visible, traversable, and interpretable.
Knowledge Graph Use Cases by Industry
Knowledge graph use cases differ across industries, but they are usually driven by the same underlying need: understanding information in context. Whether the problem involves clinical reasoning, financial risk, cyber exposure, production quality, supplier disruption, or connected infrastructure, the graph becomes valuable when relationships are central to the decision. The following examples show how that principle appears in different enterprise environments.
Healthcare: Clinical Decision Support, Drug Interactions, and Drug Discovery
Healthcare organizations often need to make decisions from information that was never designed to be viewed as one connected picture. A patient record may show part of the clinical story, but the evidence needed to understand that story often sits across clinical, research, and operational systems that were not designed to work together.
Knowledge graphs help bring this information into a connected semantic model. In clinical decision support, they allow clinicians to understand how a diagnosis relates to previous treatments, medication history, outcomes and, where appropriate, analytically identified comparable cases or patient cohorts. This broader context can surface risks or care patterns that may be difficult to identify in tabular records alone.
This is especially important when decisions depend on several layers of clinical context. A medication, for example, cannot be evaluated only against a diagnosis. Teams also need to understand whether the patient’s history, risk profile, and comparable outcomes support that decision. By representing these relationships in a single model, knowledge graphs can help to support safer, more informed decision-making by providing more complete clinical context.
The same approach can support clinical trial matching and drug discovery. Researchers can use connected biomedical knowledge to evaluate eligibility, compare treatment histories, examine disease-pathway relationships, and identify opportunities for drug repurposing. In these use cases, the graph does not replace clinical expertise. It gives experts a more coherent way to explore complex medical and research knowledge.
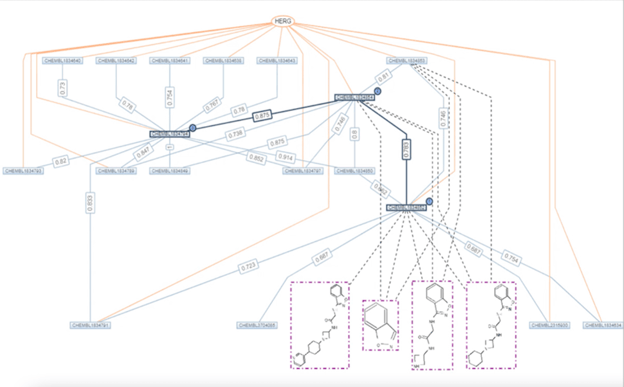
A knowledge graph of the chemical composition of a drug and possible alternative formulations.
This example, developed in cooperation with Sanofi, illustrates how a very technical knowledge graph was applied to analyze alternative preparations of a specific medical compound.
Finance and Banking: Fraud Detection, AML, and Counterparty Risk
In finance and banking, knowledge graphs help institutions understand risk as a connected network rather than a series of isolated records. Financial risk often emerges when a transaction is understood within the broader behavioral, account, device, jurisdictional, and regulatory context surrounding it. A single activity may appear routine on its own but become significant when viewed as part of a wider pattern.
By mapping these relationships, knowledge graphs make it easier to investigate suspicious activity and identify patterns that transaction-by-transaction monitoring approaches may miss. Analysts can follow the path from one suspicious signal to another and reveal patterns that would be difficult to detect from transaction records alone.
This connected view is especially valuable for fraud detection and anti-money-laundering investigations. Analysts can trace flows of funds, ownership relationships, and potential channels of influence across accounts, entities, and jurisdictions, helping them identify layering patterns, beneficial ownership structures, and hidden exposure chains. Instead of reviewing each account or transaction separately, teams can follow the path of risk through the wider financial network.
Knowledge graphs also support counterparty risk analysis by revealing second- and third-order dependencies across complex financial structures. This gives risk and compliance teams a clearer view of who is connected to whom, where exposure may exist, and how one relationship may affect another. As a result, financial institutions can improve the quality of investigations, support regulatory compliance, and make better-informed decisions across fraud, AML, and risk management workflows.
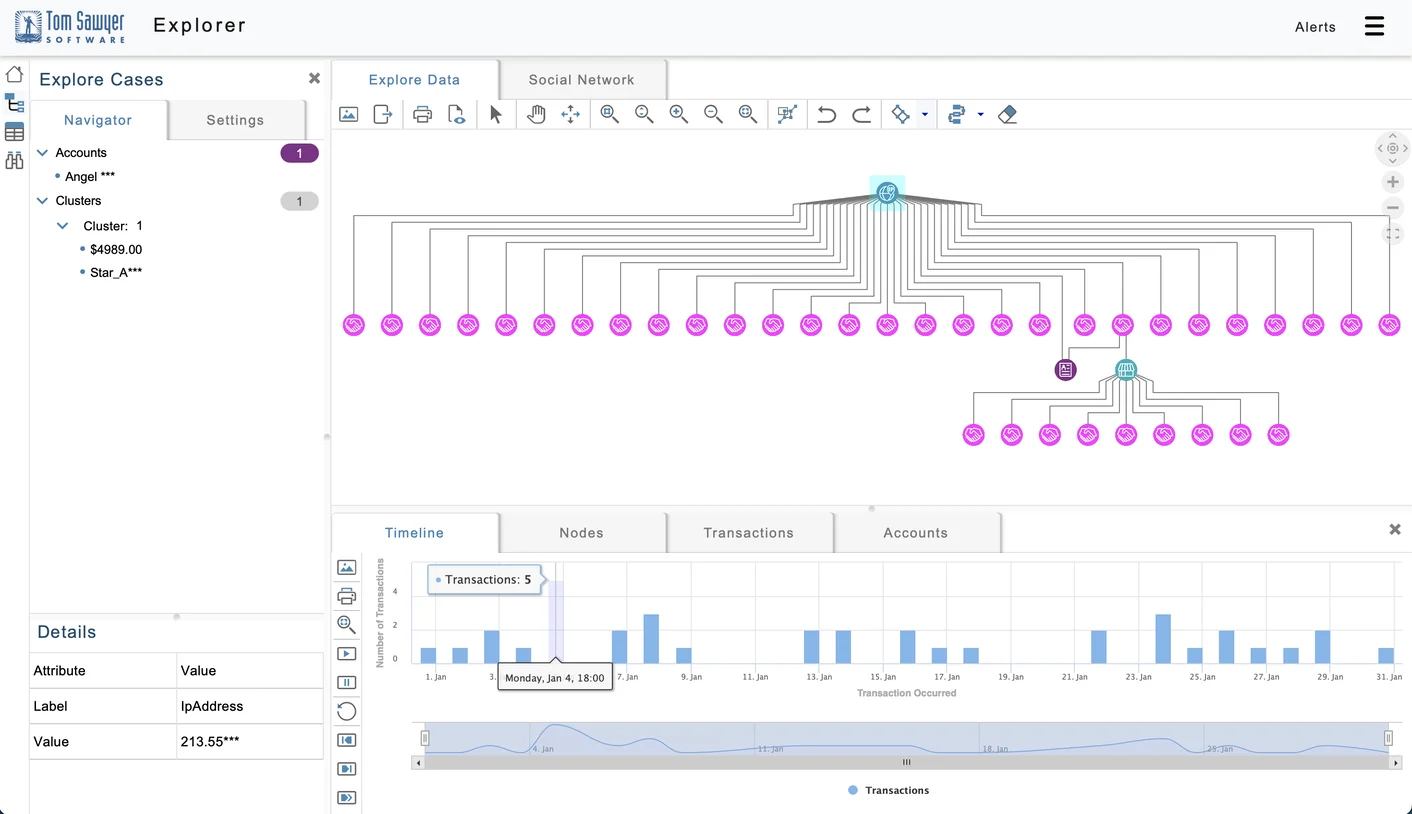
Graph visualization and timeline of suspicious transactions.
Cybersecurity: Attack Paths, Asset Exposure, and Threat Intelligence
Modern cybersecurity is less about individual alerts and more about understanding how risk propagates across an environment. A vulnerability may appear manageable in isolation yet become critical when it creates a path to a sensitive asset or exposes a chain of interconnected systems. This makes context as important as detection itself.
Knowledge graphs help security teams represent that context as a connected model of the digital environment. Instead of treating a security alert as an isolated event, the graph shows how the alert relates to the affected asset, the involved identity, and the possible path through the environment. When a threat indicator appears, analysts can evaluate the affected system and trace the possible paths an attacker could follow toward a high-value target.
This relationship-aware view can improve prioritization. Security teams can move beyond severity scores alone and focus on the vulnerabilities, assets, and access paths that create the greatest operational risk. A lower-scoring vulnerability may warrant urgent attention if it lies on a path to a critical system, while a higher-scoring issue may be less urgent if it is isolated from sensitive assets.
Knowledge graphs also strengthen threat intelligence workflows. During an active incident, analysts can connect indicators, affected systems, user activity, known exploits, and observed behavior into a clearer picture of what is happening. This can reduce investigation time and help teams respond based on modeled or observed exposure paths rather than isolated security signals.
Manufacturing: Equipment Hierarchies, Process Dependencies, and Quality Traceability
In manufacturing, a production issue is rarely explained by a single record. A quality deviation may begin with a change in process conditions, but its cause may only become clear when teams can trace the relationship between the equipment involved, the material batch, prior maintenance activity, and supplier history.
Knowledge graphs help manufacturers represent these dependencies as a connected operational model. Instead of treating equipment, processes, materials, and quality data as separate records, the graph shows how they relate across the production lifecycle. This is especially valuable in complex facilities where assets are organized into layered physical and logical hierarchies, from production lines and machines to components, sensors, and control systems.
This connected structure is especially useful during root cause analysis. When a quality deviation occurs, teams do not have to review process data, inspection records, and supplier information as separate pieces of evidence. They can follow the production path backward to understand where the issue may have started and which upstream conditions may have contributed to it. In regulated sectors such as aerospace, pharmaceuticals, and automotive, that traceable path also supports audit readiness by linking production decisions to the materials, equipment, and processes that underlie the final product.
Knowledge graphs can also serve as a semantic backbone for industrial digital twins. By connecting sensor data, equipment specifications, maintenance history, process dependencies, and behavioral models, they help organizations build a more complete and coherent picture of a physical asset, production line, or facility. This gives teams a stronger foundation for predictive maintenance, operational analysis, and continuous process improvement.
Supply Chain: Multi-Tier Supplier Graphs, Disruption Propagation, and ESG Provenance
Supply chains have become increasingly difficult to understand through traditional reporting alone. Organizations can still struggle to understand how disruption propagates through the wider network even though they have strong visibility into direct suppliers and logistics operations. The challenge is the difficulty of seeing how a dependency at one point in the supply chain can affect materials, routes, operations, and products several steps downstream.
Knowledge graphs help supply chain teams model these dependencies as a connected network. Instead of looking only at individual suppliers or shipments, teams can understand how a supplier relationship influences material availability, production capacity, product exposure, and downstream obligations. This is especially important when risk originates beyond tier-1 suppliers, where visibility is often limited.
When a disruption occurs, the graph provides a way to trace its potential impact through the network. A factory closure, port delay, certification issue, or regional restriction can be evaluated in relation to affected materials, alternative sources, logistics constraints, and products that may be exposed. This gives teams a more practical basis for response planning than static supplier reports.
The same connected model can support environmental, social and governance standards (ESG) and associated sustainability analyses. Material provenance, supplier certifications, emissions data, and regional risk signals become more useful when they can be interpreted in relation to the products and facilities they affect. In this context, the knowledge graph becomes a way to understand not only where supply chain data exists, but how operational, regulatory, and sustainability risks move through the network.
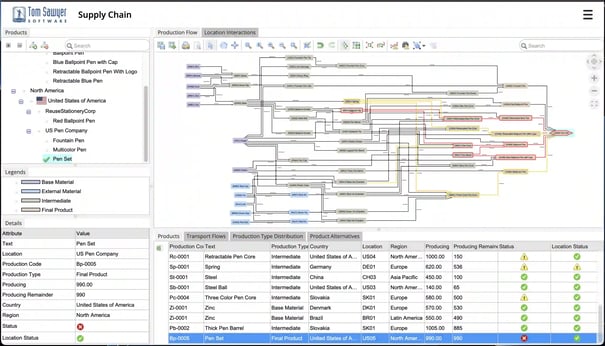
A dashboard for the management of global supply chain issues showing at risk paths in the chain, and related downstream impact.
Recommendation Systems and E-Commerce: Semantic Relevance Beyond Collaborative Filtering
Recommendation systems are one of the clearest examples of how knowledge graphs add value beyond pattern recognition. Traditional recommendation models often rely heavily on behavioral similarity, such as what users clicked, purchased, or viewed together. That approach can be effective, but it does not always explain why a recommendation is relevant or how it relates to the user’s actual intent.
Knowledge graphs add a semantic layer to recommendation logic by showing how products relate to user intent, compatibility requirements, and the surrounding content or product ecosystem. This allows recommendations to reflect meaning rather than only behavioral correlation.
In an e-commerce environment, this becomes especially valuable when relevance depends on context. A customer researching a technical product may need compatible components, supporting documentation, related accessories, or alternatives that match a specific use case. A graph-based model can follow those relationships and produce recommendations that are more explainable and often more relevant than suggestions based only on similar user behavior.
The same principle applies to media, publishing, and enterprise search experiences. When articles, topics, authors, product concepts, and user roles are connected in a knowledge graph, personalization can reflect topical relevance and editorial structure rather than keyword overlap alone. This makes knowledge graphs useful not only for increasing engagement but for improving the quality and explainability of recommendation and discovery systems.
IoT and Smart Infrastructure: Making Connected Data Coherent
The challenge in IoT environments is rarely collecting data. Modern infrastructure already produces more operational data than most teams can interpret through disconnected monitoring tools. The real difficulty lies in understanding how that information relates to the physical assets, processes, locations, and real-world conditions it represents.
Knowledge graphs provide a semantic layer that makes IoT data more coherent. Instead of treating sensor readings as isolated streams, the graph connects them to the assets being monitored, the systems those assets belong to, and the operational context in which events occur. This helps teams interpret signals in richer operational context and understand why a change in one part of the environment may affect another.
In smart infrastructure, this connected model can support more coordinated operations. Individual signals become more useful when operators can understand how activity in one system affects conditions elsewhere in the urban or operational environment. Teams can move from monitoring isolated signals toward more coordinated analysis and management of interdependent systems.
Industrial IoT use cases follow the same principle. Sensor data becomes more valuable when it is connected to equipment models, maintenance history, process parameters, and operating conditions. This relationship-aware view supports anomaly detection, predictive maintenance, and operational analysis at scale.
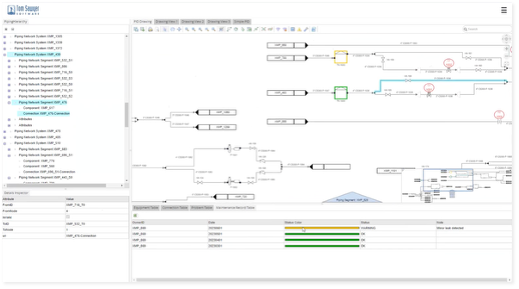
Process and instrumentation diagrams combine topological information, equipment meta-data, and real-time sensor data and analysis to present actionable information about connected physical systems.
Knowledge Graphs for AI and Large Language Models
Knowledge graphs are becoming increasingly important in AI systems because they provide large language models with structured, organization-specific context. An LLM can generate fluent answers from patterns learned during training, but enterprise use cases often require a more reliable connection to current business knowledge and the relationships that give that knowledge meaning.
This is where knowledge graphs add value. Instead of retrieving only isolated documents or passages, a graph-augmented AI system can retrieve context through entities, relationships, dependencies, and semantic paths. In a Graph RAG architecture, retrieval can combine vector similarity with graph structure, giving the model context drawn from both relevant content and explicit relationships. It can retrieve not only relevant information, but also the relationships that connect that information to other facts in the organization’s data environment.
That relationship structure is especially important for questions that require more than one step of reasoning. A model may need to understand why a product is affected by a regulatory change, how a vulnerable asset relates to a critical system, or how a supplier issue could influence a finished product. In these situations, isolated content is often not enough. The graph provides a connective structure that can improve retrieval of relevant evidence and context for these types of questions.
Knowledge graphs also help keep AI outputs grounded in current enterprise information. Large language models do not automatically know about new products, ownership changes, system configurations, policy updates, or operational relationships that appear after training. A regularly or continuously updated graph can act as a source-aware enterprise knowledge layer that the model queries at runtime, reducing the risk of outdated or unsupported responses.
For agentic AI systems, a knowledge graph can contribute to a persistent memory and reasoning architecture by storing entities, relationships, provenance, and operational context. Agents can use it to identify dependencies, retrieve operational context, evaluate relationships between entities, and plan actions based on current organizational data. Rather than operating from disconnected retrieved passages, the agent gains access to a structured representation of relevant organizational knowledge that can support more reliable planning, decision-making, and task execution.
This structure can also improve explainability. When an answer, recommendation, or decision is based on a path through the graph, teams can inspect the entities and relationships behind the output. That can make graph-based AI easier to inspect, audit, and validate, although trust still depends on data quality, provenance, model behavior, and application governance. This is especially important in high-stakes environments where organizations need to understand not only what the model produced, but why it produced it.
Quick Reference: Knowledge Graph Use Cases by Industry
|
Industry |
Knowledge Graph Use Case |
What the Graph Connects |
Potential Business Value |
|
Healthcare |
Clinical decision support |
Patients, diagnoses, medications, outcomes |
Better-informed treatment decisions, potential reduction in adverse events |
|
Healthcare |
Drug discovery |
Compounds, pathways, diseases, trials |
More efficient candidate identification, potential to reduce cost and time-to-market |
|
Finance |
Fraud ring |
Accounts, devices, transactions, known actors |
Earlier investigation and potential loss reduction |
|
Finance |
AML / beneficial ownership |
Entities, jurisdictions, ownership chains |
Regulatory compliance, reduced investigation time |
|
Cybersecurity |
Attack path |
Assets, vulnerabilities, users, network paths |
Risk-prioritized remediation |
|
Cybersecurity |
Threat intelligence |
Threat actors, TTPs, indicators, infrastructure |
Proactive defense, faster response |
|
Manufacturing |
Quality traceability |
Materials, processes, equipment, test results |
Audit readiness, |
|
Manufacturing |
Digital twin |
Sensors, equipment, maintenance, dependencies |
Predictive maintenance, operational insight |
|
Supply chain |
Multi-tier supplier mapping |
Suppliers, materials, regions, certifications |
Disruption visibility, sourcing agility |
|
Supply chain |
ESG provenance |
Components, suppliers, emissions, certifications |
Scope 3 reporting, sustainability compliance |
|
E-commerce |
Product recommendation |
Customers, products, attributes, behavior |
Improved relevance and potential conversion lift |
|
IoT |
Smart infrastructure |
Sensors, systems, events, locations |
Real-time operational awareness |
|
AI / LLM |
Graph RAG |
Entities, facts, relationships, retrieval paths |
Potential reduction in unsupported answers or hallucinations, |
Knowledge Graph Visualization: Turning Connected Data into Insight
A knowledge graph delivers value when teams can query, explore, and visualize its relationships to solve a specific business objective. Purpose-built visualization and analytics tools make the connected structure of raw graph data more accessible to analysts and decision-makers.
Tom Sawyer Perspectives is a low-code graph visualization and analysis development platform for building custom knowledge graph applications. Tom Sawyer Perspectives accesses the data stores you already own to populate the in-memory knowledge graph that you design. Analysts can explore complex entity-relationship networks, apply graph algorithms to surface patterns and anomalies, and present findings in visual formats that support decision-making without requiring deep expertise in graph databases.
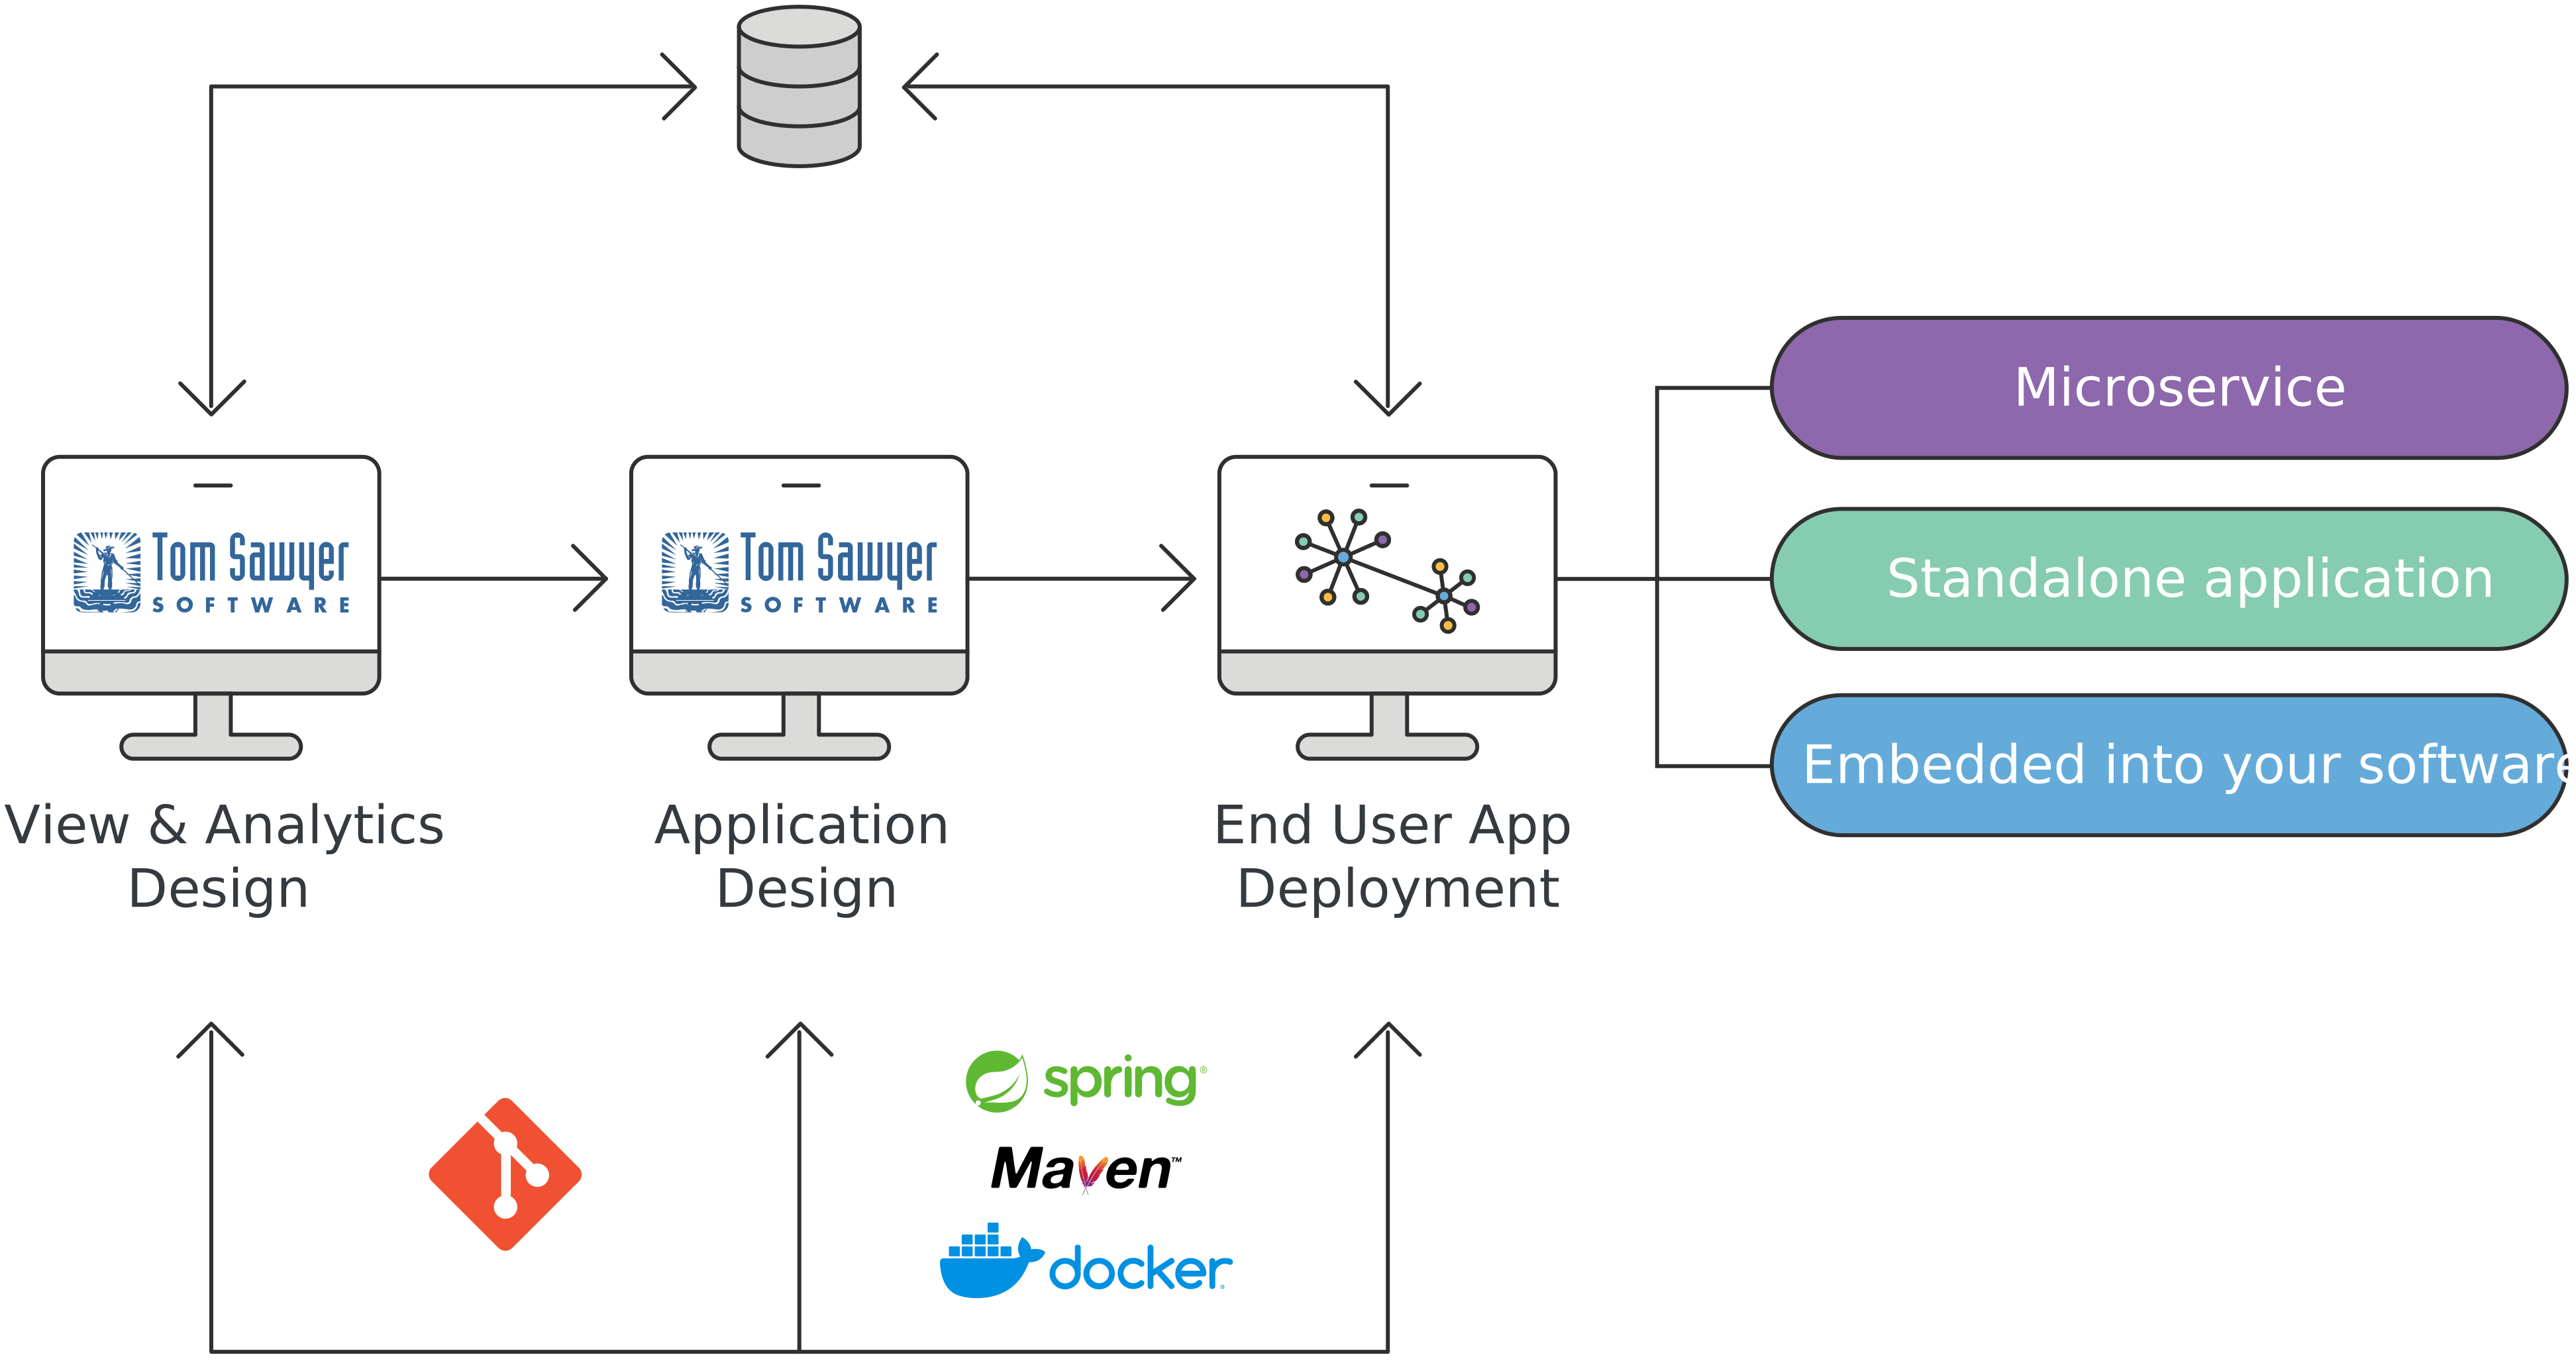
Build, deploy, and integrate graph visualization applications with Tom Sawyer Software, supporting flexible deployment as standalone applications or embedded components.
Tom Sawyer Perspectives supports enterprise deployment requirements as a standalone web or desktop application or as an embedded component within existing systems. It integrates with graph databases, semantic stores, and real-time data streams, providing the interactive exploration, temporal analysis, and algorithm-driven insight that enterprise graph applications require. For organizations building or scaling knowledge graph solutions, Perspectives provides an analytical and visualization layer for turning connected data into operational insight.
How to Choose the Right Knowledge Graph Use Case
A knowledge graph is most valuable when the business problem cannot be understood through isolated records alone. Before building one, organizations should start with the decision they need to support and then work backward to the entities, relationships, and data sources required to clarify that decision.
The strongest use cases usually appear when the organization needs to follow a relationship across systems. In a risk workflow, that may mean understanding how an account, transaction, device, and entity are connected. In an operational workflow, it may mean seeing how a supplier, material, facility, and finished product influence one another. The specific domain may change, but the underlying question is similar: Does the value come from seeing how things are connected?
Organizations should also consider whether the use case requires explanation, not only prediction or classification. If analysts need to understand why a recommendation, alert, or risk score was generated, a knowledge graph offers a clear advantage, as conclusions can be traced via visible paths.
The goal is not to build the largest possible graph. The goal is to create a focused model that supports a specific decision, workflow, or analytical process. A well-scoped knowledge graph should make the business problem easier to investigate, explain, and act on.
Challenges in Knowledge Graph Deployment
Building a knowledge graph is often described as a data initiative, but in practice, it is an organizational and engineering challenge. Success depends not only on the graph itself, but on the quality of the underlying data, the way knowledge is modeled, and the ability to integrate information from systems that were never designed to work together.
Many organizations begin with the assumption that connecting data sources will automatically produce better insight. In reality, a knowledge graph will expose the same inconsistencies, gaps, and governance issues that already exist across the enterprise. If different systems describe the same customer, supplier, asset, or product in different ways, those conflicts must be resolved before the graph can become a trusted source of knowledge.
The way the domain is modeled presents another challenge. A knowledge graph is valuable because it captures meaning, not simply data. The ontology or semantic model determines how entities relate to one another, which relationships matter, and how users and applications can interpret those connections. Designing a model that accurately reflects the business while remaining flexible enough to evolve over time requires both technical expertise and deep domain knowledge.
As adoption grows, organizations must also address scale. What may begin as a focused initiative can quickly expand into a graph containing millions or even billions of connected facts. Supporting complex traversals, analytical workloads, AI-driven applications, and near-real-time updates often benefits from infrastructure designed or optimized for graph workloads rather than conventional reporting alone.
Integration is often where the greatest effort lies. Enterprise knowledge rarely exists in a single location. Critical information is usually spread across systems that were built for different teams, workflows, and levels of structure. Bringing these assets together into a coherent knowledge model requires ongoing investment in data pipelines, governance processes, and maintenance.
For this reason, the most successful knowledge graph initiatives are rarely treated as one-time technology projects. Organizations that generate long-term value typically approach knowledge graphs as strategic information assets that evolve alongside the business, continuously improving as new data sources, requirements, and use cases emerge.
Conclusion
Knowledge graphs are most valuable when organizations need to understand relationships that are difficult to see in isolated systems. Their strength comes from making connections explicit, whether those connections involve customers, transactions, assets, suppliers, systems, risks, or decisions.
As enterprise environments become more fragmented, this connected view becomes increasingly important. Knowledge graphs provide the semantic structure needed to turn scattered information into operational insight, helping teams trace dependencies, recognize patterns, and explain how one part of the business affects another.
When combined with visualization and graph analysis, knowledge graphs become more than a data architecture. They give analysts, decision-makers, and AI systems a clearer way to explore complex information and act on it with greater confidence.
About the Author
Liana Kiff is a Senior Consultant, bringing more than 25 years of software innovation, design, and development experience to Tom Sawyer Software. Prior to Tom Sawyer Software, Liana worked on graph-based approaches to industrial information management at Honeywell’s corporate labs, where she acquired deep domain knowledge related to commercial, and industrial customers of advanced control solutions. As a champion of information standards and model-driven approaches, she led the development of a common ontology for use across a wide range of building automation solutions and managed the development of cloud-based services and APIs for enterprise software development. Liana holds a Master of Software Engineering degree from the University of Minnesota.
AI Disclosure: This article was generated with the assistance of artificial intelligence and has been reviewed and fact-checked by Caroline Scharf and Liana Kiff.
FAQ
What are some real-world examples of knowledge graphs?
Real-world examples of knowledge graphs include fraud-ring detection networks in financial services, clinical trial matching systems in healthcare, attack-path models in cybersecurity, multi-tier supplier maps in supply chain management, product recommendation systems, digital-twin integration, and Graph RAG architectures that ground large language model outputs in verified organizational knowledge.
Why are knowledge graphs useful for AI applications?
They are useful for AI because they provide structured, current, and explainable context. In Graph RAG architectures, retrieval can leverage graph structure, semantic relationships, or graph traversal paths among entities, facts, and relationships, providing AI systems with more precise information for multi-hop reasoning.
What is the difference between a knowledge graph use case and a graph database use case?
A graph database use case focuses on using graph-oriented storage and queries. A knowledge graph use case focuses on representing entities, relationships, meaning, identity, and often provenance or domain semantics. A knowledge graph may be implemented in a graph database, but it does not have to be.
When should an organization use a knowledge graph instead of a relational database?
Knowledge graphs and relational databases serve different purposes and are often used together. Relational databases manage structured operational data, while knowledge graphs connect information across systems to provide context, meaning, and relationships. Organizations typically use a knowledge graph when connected data and relationship-based analysis are more important than managing individual records.
How does knowledge graph visualization help analysts understand complex data?
Visualization transforms abstract graph structures into navigable, interactive representations that analysts can explore without writing complex queries. In knowledge graph environments, where the model may contain hundreds of entity and relationship types, visualization helps teams identify patterns, surface anomalies, and communicate findings more clearly.
How do knowledge graphs help reduce data silos?
They help to reduce data silos by connecting information from separate systems through a shared semantic layer. Each source maps to a common model, allowing information from CRMs, ERPs, data warehouses, external feeds, and other systems to become jointly queryable without requiring full physical consolidation.
How do knowledge graphs improve supply chain transparency?
They improve supply chain transparency by mapping supplier relationships, logistics routes, inventory positions, materials, certifications, and risk indicators across multiple tiers. This helps organizations understand their exposure to disruption, identify alternative sourcing paths, and support sustainability reporting.
How do knowledge graphs support Graph RAG?
Knowledge graphs support Graph RAG by adding relationship-aware retrieval to large language model workflows. Vector similarity retrieval matches documents based on statistical proximity. Graph RAG can add entity-linked retrieval, neighborhood expansion, graph traversal, graph summaries, or other relationship-aware retrieval techniques. This helps AI systems answer multi-hop questions, reduce hallucination risk, and ground outputs in verified organizational knowledge.
Submit a Comment