
Caroline Scharf
Vice President of Operations
Thanks to our amazing global community, we grew revenue 30% in 2016 in existing and new customer accounts and discovered innovative new use cases. Now we’d like to give back by sharing what we’ve learned in our Newsletter Blog post. Read on to learn about market trends, industry standards, upcoming events, and what’s new in product development.
Market Trends
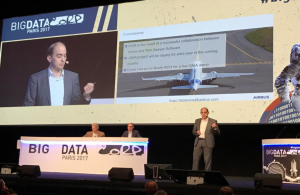
We see a rise in graph and data visualization activity across market segments including automotive, aerospace and defense, geospatial intelligence, enterprise network and IT Infrastructure, and model-based engineering. For example, at Big Data Paris 2017, Airbus outlined their innovative approach to model-based systems engineering (MBSE) using graph and data visualizations. To support MBSE, they use Tom Sawyer Perspectives to integrate diverse data sourcesand synchronize views so architects, engineers, and business managers can collaborate and streamline the design and manufacture of aircraft.
The Big Data Paris conference in March attracted over 12,000 people. While talking with attendees at the booth and in our Workshop, we learned that one of the greatest challenges in big data is integrating diverse data stores to meet operational and mission-critical needs. Speakers and attendees also voiced the need to go beyond charts and heat maps to more sophisticated data visualizations. They want tidy, easy to read, and interactive link analysis of connected data, network topologies, enterprise architectures, and systems models.
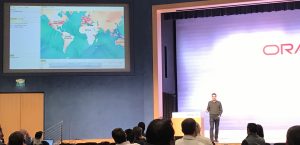
At the Oracle BIWA and Spatial Summit, the Geospatial sessions were standing room only—indicating a growing interest in visualizing and analyzing data for government intelligence use cases. As the premier visualization software for Oracle Big Data Spatial and Graph, we were honored to be among the guest speakers.
In the keynote presentation, “How a Tweet went Viral,” Mark Rittman replayed his 11-hour struggle with a Wi-Fi kettle to make a cup of tea and described what happened on Twitter when he tweeted about it. Mark used our software to demonstrate how his tweet spread around the world and to identify the super-connectors who amplified its reach.
Industry Standards and Events
We have found a groundswell of excitement and interest in Model-Based Systems Engineering, and believe it’s the future of 21st-century design and manufacturing. Industrial processes generate massive amounts of data in engineering, operations, finance, and logistics, driving the growing need for integration, modeling, and visualization.
In January, we participated in the NASA/JPL Symposium and Workshop on Model-Based Systems Engineering. A poll of attendees revealed that 10% of systems engineers are doing MBSE now and expect it to grow to 90% over the next ten years.
We have customers in diverse industries, from consumer products and automotive, to military and manufacturing adopting the model-based approach. Are you seeing organizations moving to MBSE? Share your story with us.
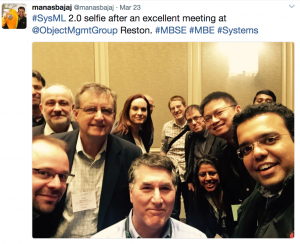
To keep our fingers on the pulse of emerging trends, we actively support and participate in membership and standards organizations such as INCOSE, USGIF, and the Object Management Group. We attended the OMG quarterly Technical Meeting in Reston, Virginia, to discuss and assist in developing the Systems Modeling Language standards.
One of our subject matter experts co-leads the SysML 2.0 Visualization working group and came away from the meeting excited about plans for 2.0 and the increasing focus and attention on usability.
Tom Sawyer Perspectives
We recently launched Tom Sawyer Perspectives, Version 7.6. It includes Tom Sawyer Maps, support for the OpenLayers map API and the Neo4j Bolt Protocol, and performance enhancements. This release enables enterprises and governments to create secure, private, and beautiful maps with diverse data. Through the integration of location-based information and the capabilities of a logical drawing view, our customers can now see a unified view of their data. In addition, they can create all-inclusive, multi-level nested map views with our advanced new features.
Over the past four years, our strong commitment to performance technology drove us to maintain an aggressive roadmap. We are pleased to announce that we have one of the most scalable, flexible, and beautiful graph visualization technologies on the market.
In version 7.6 memory usage improvements include:
- 26% improvement in Circular layout
- 26% improvement in Hierarchical layout
- 18% improvement in Orthogonal layout
- 31% improvement in Symmetric layout
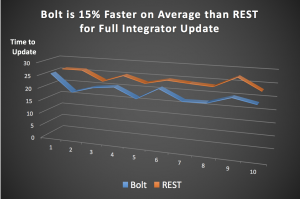
Tom Sawyer Perspectives, Version 7.6 supports the Bolt protocol when connecting to a Neo4j graph database. Bolt is a new network protocol designed for high-performance access and is the fastest integration available today for retrieving data from Neo4j. We saw a 15% response time improvement with Bolt when querying our Panama Papers data set.
To learn how you can use Tom Sawyer Perspectives’ graph visualization and analysis capabilities, try one of our many solution demos now. For more in-depth information, visit the Perspectives page.
Upcoming Events
No Magic is a recognized leader in the model-based engineering space, and we are honored to be invited to speak at their annual Worldwide Symposium May 21-24 in Allen, Texas. We are presenting in the MBSE track to discuss how customers are applying automated visualization to model-based engineering and achieving outstanding results.
We have complimentary tickets on a first come, first served basis. Contact us before they run out!
We’re also attending the following events:
- GraphConnect: May 11, London, United Kingdom
- No Magic World Symposium: May 21-24, Allen, Texas
- GeoInt Symposium: June 4-7, San Antonio, TX
- GraphDay SF: June 17, San Francisco, California
Partnerships: Neo4j, No Magic, and Oracle
This year we met with Neo4j partners from France and UK at Big Data Paris to discuss and build upon our ongoing partnership. If you are attending GraphConnect, let’s meet up!
As the premier graph visualization technology partner for Oracle, we participated in Oracle OpenWorld last fall and spoke at the Oracle Big Data & Spatial Graph Summit earlier this year.
We kicked off an exciting new partnership with No Magic and are enhancing a powerful plug-in for seamless integration. We are proud to be a platinum sponsor at this year’s No Magic World Symposium and hope to see you there!
Check Out Our Recent Blog Posts
This year we launched our blog to provide you with product, industry, and company updates. Read our latest blog posts on the release of Tom Sawyer Perspectives, Version 7.6 and the Panama Papers, and feel free to share or leave a comment.
Try an Example Application
To learn more about how you can use Tom Sawyer Perspectives graph visualization and analysis capabilities, try one of our many demonstrations.
About the Author
Caroline Scharf, VP of Operations at Tom Sawyer Software, has more than 25 years leadership experience at large and small software companies. She has a passion for process and policy in streamlining operations, a solution-oriented approach to problem solving, and is a strong advocate of continuous evaluation and improvement.
Submit a Comment