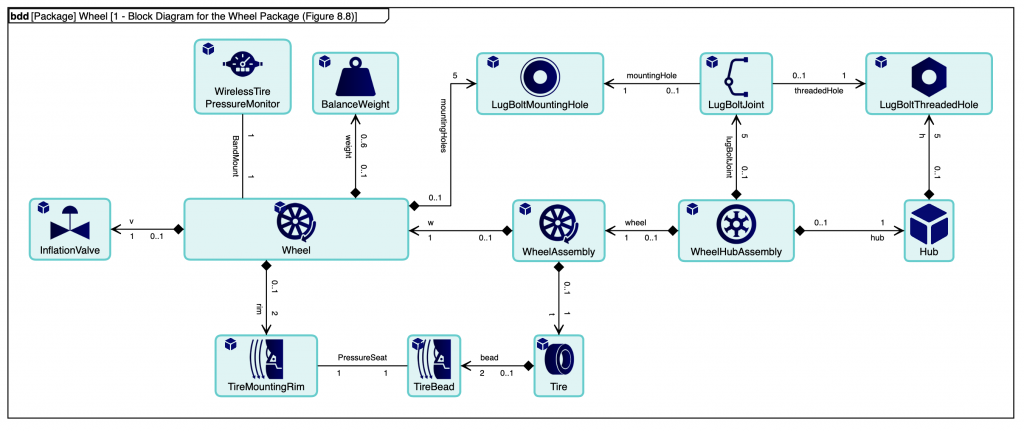
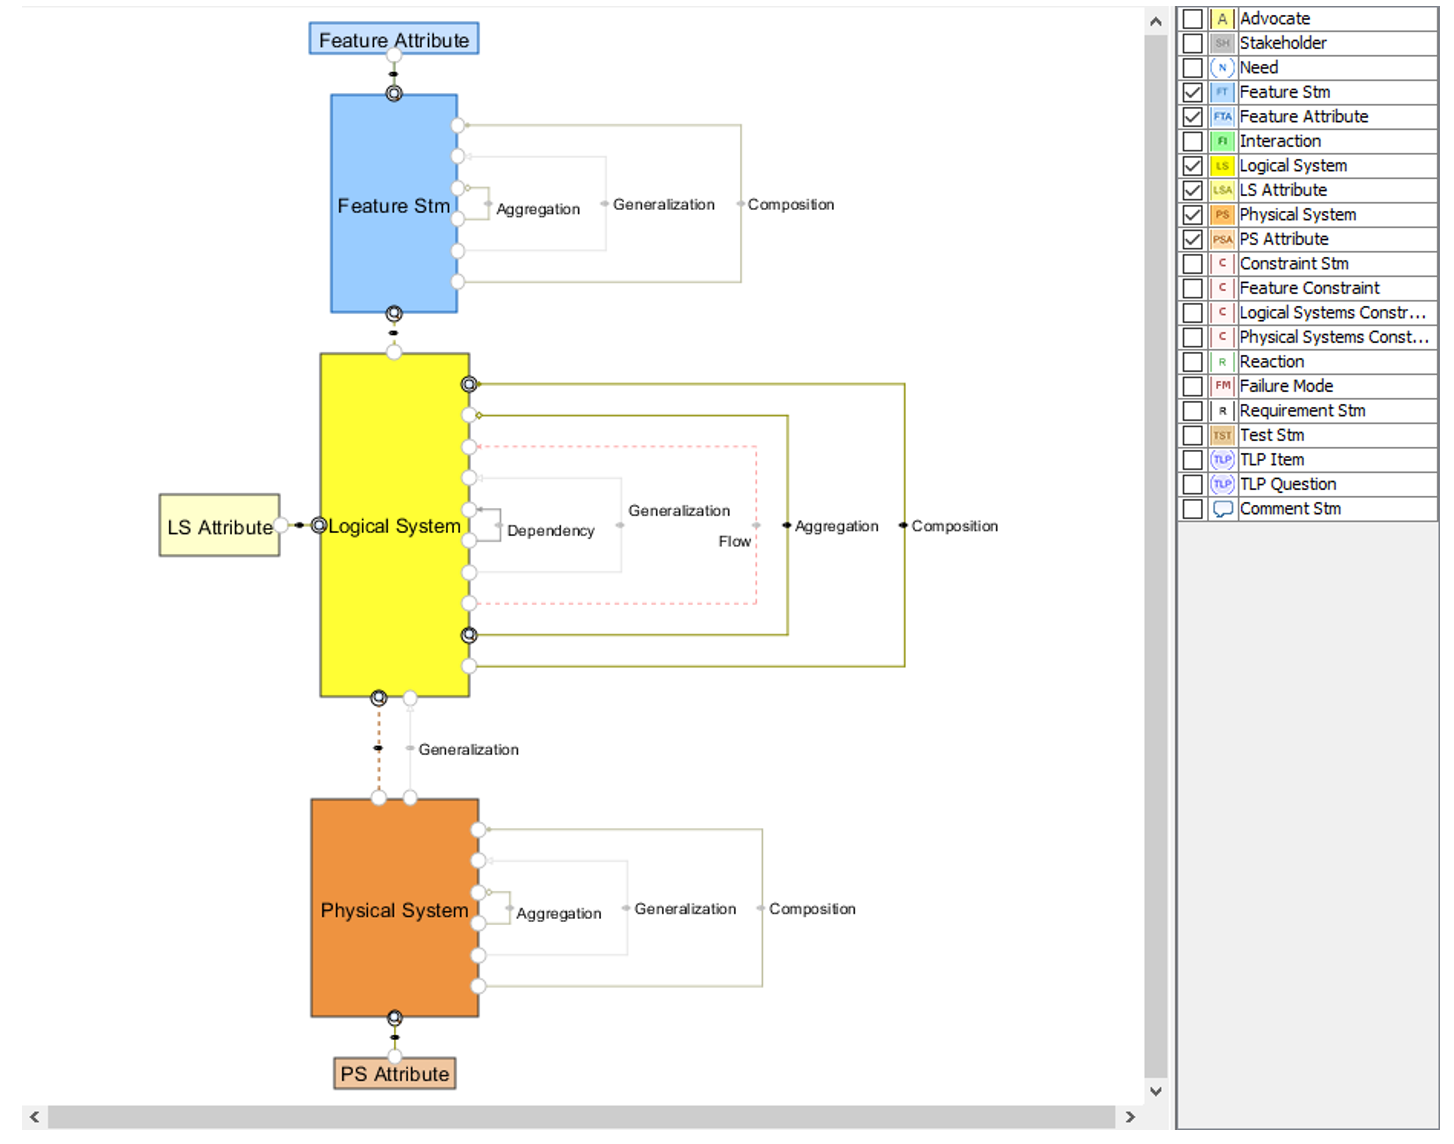
Tom Sawyer Software offers integrations with NoMagic Cameo products and IBM Rhapsody to automatically generate Systems Modeling Language (SysML) diagrams. The language provides a standard for systems engineers to use when specifying and designing complex systems. We also provide a prototype visualization for SysML v2, currently under development.

The SysML v2 Visualization Origin Story
Systems Engineering is the discipline of integrating parts into a functioning whole. It is responsible for communicating needs and capabilities between stakeholders and specialists. In the early 2000s, members of the International Council on Systems Engineering (INCOSE) and the Object Management Group (OMG) joined together to create a graphical modeling language that was tailored to the needs of systems engineers. This produced the Systems Modeling Language, or SysML, built on top of the software-focused Unified Modeling Language (UML).
SysML v1 received mixed reviews from the systems engineering community after it was released in 2007. Its UML foundation saved designers of the language from reinventing core concepts in modeling and representation. And a community of UML tool vendors was ready to support it. However, SysML inherited UML’s weaknesses along with its strengths. There was a lack of connection between system structure and behavior. The representational approach was esoteric and rigid, making training difficult. Lack of interoperability between tools made sharing models painful. And ambiguous rules for completeness of diagrams relative to the model made many errors easy to create and hard to detect.
Because of these problems, the systems engineering community has been relatively slow to adopt the model-based systems engineering (MBSE) approach. And entire competing MBSE languages, paradigms, and tool suites have been developed by individual organizations. If systems engineering is the universal solvent into which all domain experts can pour their knowledge, SysML v1 has left something to be desired.
Encountering “The SysML Problem”
Tom Sawyer Software has been powering UML rendering tools since the ’90s. But in 2013, we were unexpectedly introduced to SysML during an introductory call with a new user at the Jet Propulsion Laboratory (JPL). Caltech, my alma mater, runs JPL, so I was especially excited about this prospect. He needed to produce dozens of systems diagrams for an upcoming mission, but was running into multiple roadblocks:
- The diagrams were supposed to be overlapping subsets of the underlying model – but that underlying model was constantly changing, so hand-built diagrams constantly showed the wrong contents.
- Semantics required that certain systems appear in specific positions, consistently applied across all the diagrams. (e.g., Satellites always appear at the top of the diagram.)
- Ensuring that the contents were current, complete, and correctly arranged took hours per diagram.
- The native representations in the modeling tool were so off-putting that the project team would not know how to read them, nor would they want to. Manual transcription to PowerPoint was needed for any mass consumption of the model.
JPL’s frustrations would become a refrain we heard so frequently from other organizations we began calling it “The SysML Problem.”
Tackling “The SysML Problem”
Fortunately for all involved, our core graph and data visualization development platform, Tom Sawyer Perspectives, is extremely good at solving many elements of The SysML Problem.
- Tom Sawyer Perspectives supports data filtering, which makes it easy to define rules about which elements should be shown for a given diagram, and iterate rapidly over the diagram definitions.
- Our patented orthogonal layout paired with sequence and alignment constraints, allowed to us create automatically enforced node placement, satisfying diagram semantics.
- Automated production meant that, once we were satisfied that the filtering and layout rules were working as intended, it took no more than a cursory glance to be sure each diagram was complete and correct.
- Custom node and edge templates—with the graphics, colors, and terminology that the project team expected—were used to express all the required details of each system.

As the project rolled on, we worked together to refine the appearance and rules of the generated diagrams. Their system engineers made countless changes and additions to the underlying SysML model. Because the outputs were now decoupled from the diagrams they used for authoring, they could work more rapidly and efficiently. Before we started the automation, the engineer responsible for the outputs had spent weeks of his time updating and maintaining only a few dozen diagrams. Using the automation with Tom Sawyer Perspectives, he generated and validated a few hundred diagrams in less than an hour.
Reimagining MBSE Visualization
Bolstered by our success with JPL, we arrived at the 2015 INCOSE International Symposium with an early prototype of our Model-Based Engineering application. The symposium introduced us to a number of key players who have become major contributors to SysML v2 who will figure prominently in the next installment of this blog series.
Of the individuals we met who are not part of the SysML v2 Submission Team, Bob Sherman of Procter & Gamble has easily, albeit indirectly, contributed the most to the visualization approach in the forthcoming spec. He is both visionary and utterly pragmatic. When we started discussing The SysML Problem, he not only wanted to solve it, he wanted to attack it from first principles. And he wanted to do it in a way that let his team do their job better and faster.
We focused on three core issues:
- The SysML metamodel is too big and too confusing for non-specialist users. Bob brought Bill Schindel’s Systematica Metamodel to solve that problem.
- Diagram arrangement is time-consuming and costly. It is a distraction for people who should be doing systems engineering, not massaging boxes and lines. Tom Sawyer Software brought our decades of automatic layout and rendering experience for that one.
- SysML v1 has the notion of “views” and “viewpoints.” These capture the idea of presenting pieces of systems to categories of stakeholders. However, the standard suggests no meaningful implementation approach. Instead, SysML v1 offers nine normative diagram types that are assumed to be the primary authoring mechanism for the model. Because they are the authoring mechanism, it is assumed that diagrams will be constructed and maintained by hand. This paradigm has downstream effects that constrict engineers’ ability to both create and interrogate the model.
This last problem did not have a canned solution, and the way we came to solve it has informed a great deal of the visualization philosophy of the SysML v2 submission.
Creating a Graphical Query Language for SysML
View and Viewpoint capture the concept of retrieving and representing some data for a class of user interested in some problem. However, they give no meaningful specification of how such a thing can truly be rigorously defined and operationalized. We needed these concepts, but in a user-friendly, machine-readable form.
If you are a data scientist, you are probably asking, “Retrieving data to solve a problem? Can’t we just write a query?” Well, unfortunately, not really. First, there is no off-the-shelf query language for SysML available. Object Constraint Language doesn’t really count due to lack of implementation support. And second, the goal was to make it easier for Bob’s team to work. Starting that pitch with “Just learn a new textual query notation” won’t go very far, whether that’s OCL or SQL or Cypher. Nonetheless, a query language is the right solution to this problem. What we needed was a graphical query language that is:
- Visually clear and concise
- Robust and detailed enough to truly encode the full semantics of a problem statement
- Rigorous and flexible
Because we understood the exact use case, we focused on a narrow subset of queries: start from one specified element of interest and navigate outward along chosen types of relationships and elements. These types of queries roughly correspond with the notion of diagram types in SysML, but they are easy for users to define and extend for the exact problem at hand.
Building the System
To meet these needs, the tooling had to construct queries using familiar visual conventions. Then, it had to execute those queries against large SysML models that are not built to be queried in this way. Finally, the tooling had to render the query results as production-quality diagrams. Through the magic of retrospection, we’ll jump ahead and treat all these problems as solved.

A great deal of this work was more software engineering than language design. But it didn’t need to be. We worked hard because SysML didn’t make the work easy. There was no concept of a query. There was no concept of a fluidly defined diagram pattern. There was no assumption that diagrams should be transient and subservient, rather than the center of the modeling universe.

Lessons Learned
What SysML v1 taught us is that systems engineers need rigor and specificity—things that SysML delivers. But they also need convenience, efficiency, and flexibility—areas where one might charitably say SysML fails to excel. Diagrams are tools that do a variety of jobs. A language that circumscribes those jobs with predefined rules and clunky paradigms will chafe its user. Diagrams, like all other views, should represent the model rather than embody it. They have been granted primacy and longevity by virtue of UML’s legacy, not because such special treatment actually serves systems engineers.
These issues were front and center as the SysML team at OMG submitted its RFP for a 2.0 spec and prepared to become part of the SysML v2 Submission Team. The SysML v2 Submission Team—over 150 members representing 70 organizations—has worked doggedly to solve the issues with SysML v1. The goal is to have a language that does the job that systems engineers need it to do.
Stay tuned for our next installment, which will cover how the initial submission of SysML v2 addresses these issues and delivers a superior language for systems engineering.
Want to try our Model-Based Engineering application? Click here to try a free demonstration.
About the Author
Joshua Feingold is the Chief Technology Officer at Tom Sawyer Software. He's a Software Architect with experience providing solutions for customers across the spectrum of public and private, large and small, and technical and conceptual. He brings curiosity, an open mind, and a strong background in mathematics, engineering, software, and social and physical sciences to bear on the hardest problems facing modern organizations. He holds a Bachelor of Science in Mechanical Engineering from Caltech.

Submit a Comment