
Janet Six, Ph.D.
Senior Product Manager
Are you a student or professor who works with networks, systems models, life sciences models, or other relationship data? Now you can use Tom Sawyer Perspectives to uncover hidden connections in your data, at no cost for non-commercial usage. Perspectives includes a complete graph visualization software development kit with a graphics-based design and preview environment, Tom Sawyer Model-Based Engineering, Tom Sawyer Explorations, and Tom Sawyer Business Process. Use Perspectives to visualize and analyze:
- Network topologies
- IT operations
- Architectures and models
- Schematics
- Dependencies
- Flows
- Social networks
- Processes
- And more …
Here are some examples of what you can do with Perspectives. All of these visualizations are data-driven and created automatically!
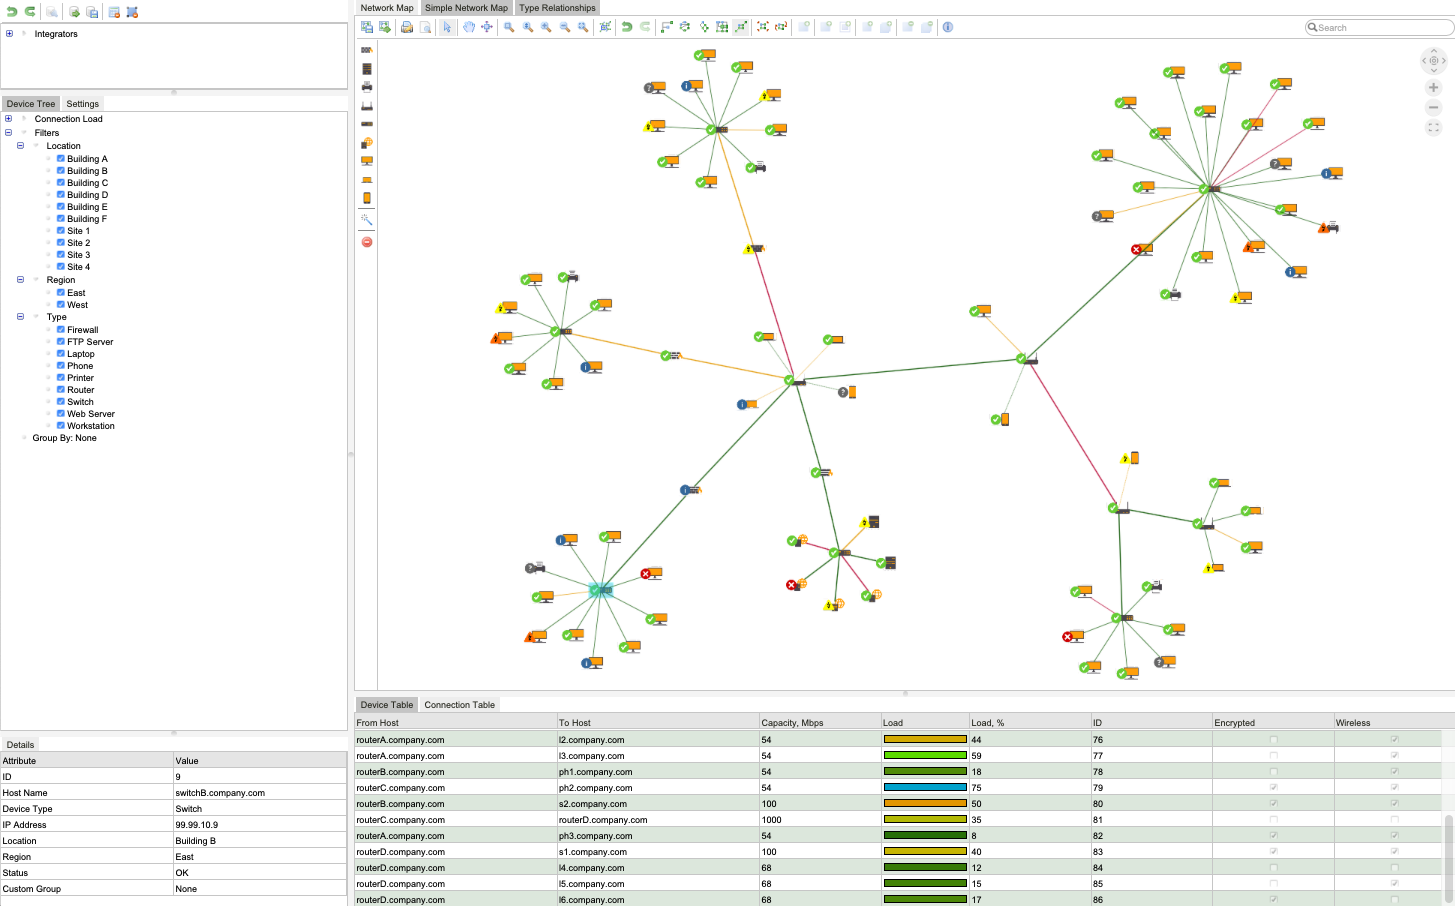
Model Your IT Network
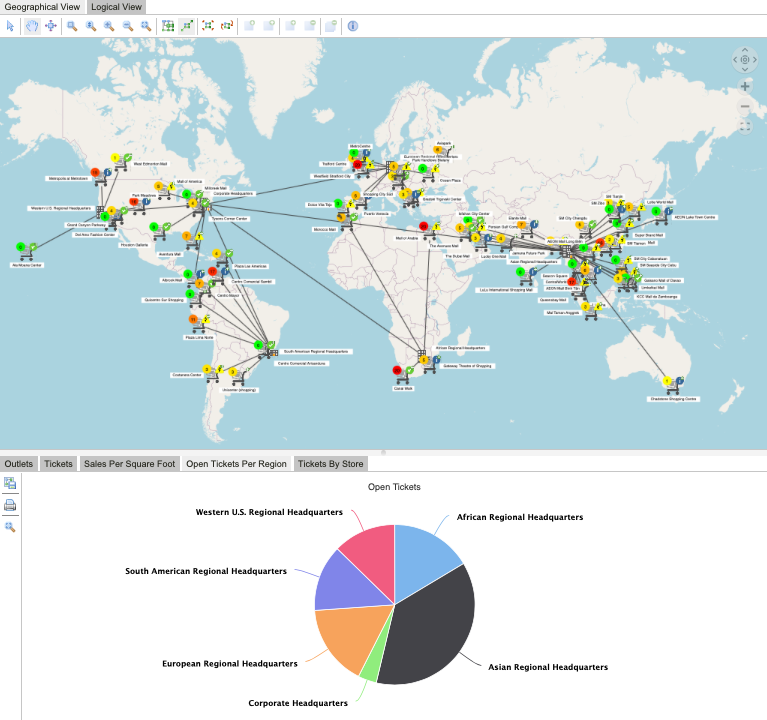
See the Geospatial Location of Your Connected Data
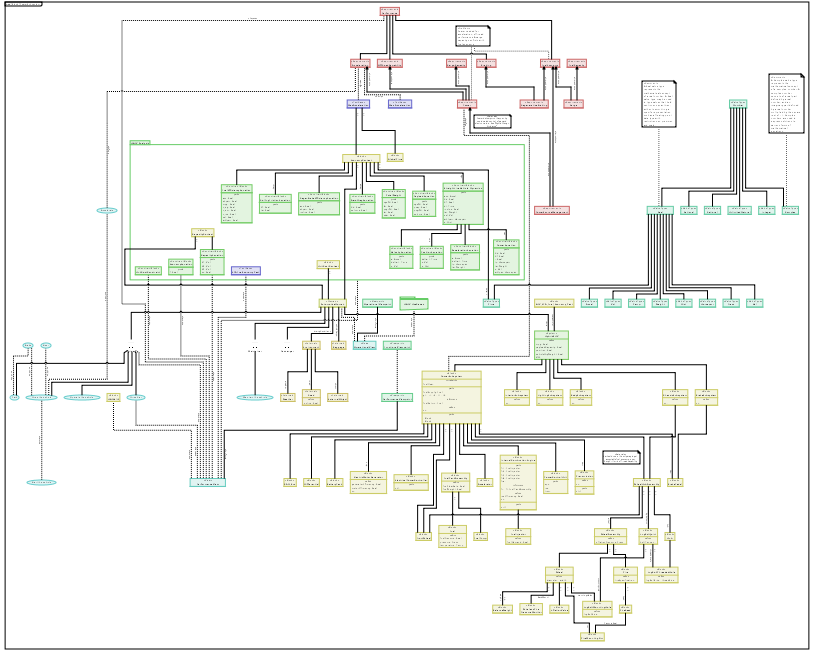
Visualize SysML Models
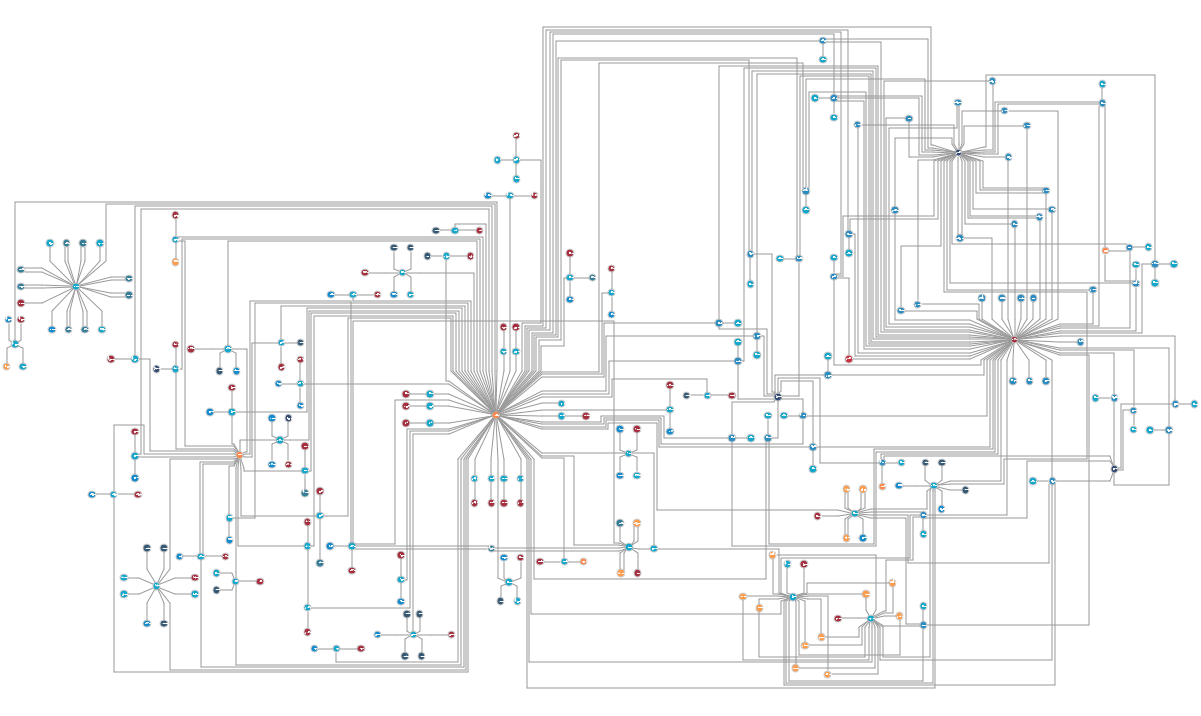
Explore and Analyze Your Graph Database
Global 2000 companies use Perspectives for data visualization and analysis, and now students and faculty can bring that power to the classroom and research labs. Knowing the importance of research and education, Tom Sawyer Software is proud to support research projects, teachers in the classroom, ongoing coursework, Master’s theses, Ph.D. dissertations, and post-doctoral research. We appreciate your attribution of Tom Sawyer Software in technical papers, journal papers, Master’s theses, and Ph.D. dissertations.
Students and faculty can request an academic license, free for non-commercial usage with no customer support. You’ll receive our software, complete product documentation, and a suite of example projects.
Try it for yourself! Post your new graph layout and analysis results to social media with #TSPerspectives and #graphviz. We can’t wait to see the results you discover in your Perspectives applications.
Request your free 1-year academic license today!
About the Author
Janet Six, Ph.D. is Senior Product Manager at Tom Sawyer Software, where she works with business, technical, and design teams to help create effective data visualization and analysis solutions within technical, time, and financial constraints. She has been in the graph field for almost 30 years. Her work has appeared in the Journal of Discrete Algorithms, Journal of Graph Algorithms and Applications, and the Kluwer International Series in Engineering and Computer Science. The proceedings of conferences on Graph Drawing, IEEE Information Visualization, and Algorithm Engineering and Experiments have also included the results of her research. Her interests include graph visualization, analysis, and artificial intelligence.
Submit a Comment