
Joshua Feingold
Chief Technology Officer
Tom Sawyer Perspectives 10.0 is our biggest, most ambitious release yet! Designed with developers in mind, this powerful release makes creating modern graph visualization applications easier, faster, and more intuitive than ever before—especially regarding schema. Perspectives 10.0 completely rethinks the way developers work with data, create custom schema, and use that schema to design graph visualizations.
Thinking of Models as Graphs
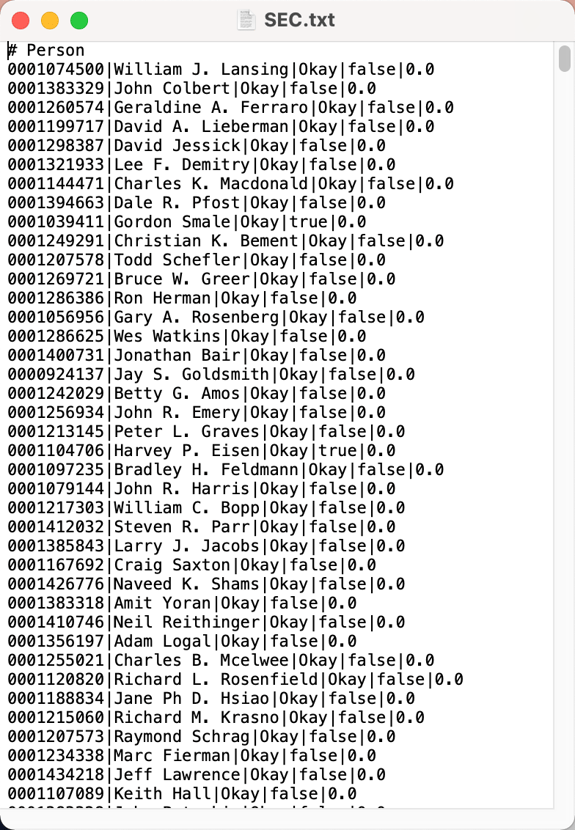
The first step in any big data visualization and analysis process is to ingest your data. In the past, most developers thought of models as rows with attributes and references to other row identifiers. In keeping with that mentality, Perspectives pulled data from a relational database into its session-scoped model.
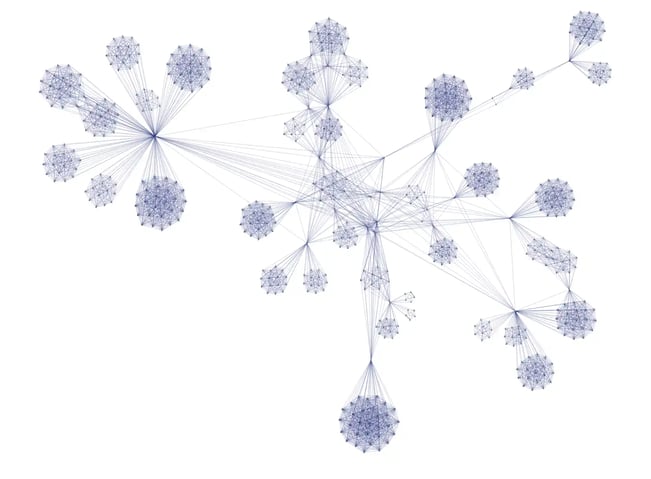
Modern graph visualization developers tend to conceptualize data differently. While many users still pull data from an RDBMS, an increasing number use graph-based data storage and think about their data in graph-like ways.
Working with Models as Graphs
The new Perspectives schema editor interface presents data as a graph to help developers view and define schemas. Fundamentally, data in the schema editor displays as a property graph where:
- Node types are green.
- Edge types are shown either as red edges or as red nodes, with their source and target indicated with edges.
- Attributes can be values or references if you need to support concepts like multiple foreign keys in a single row.
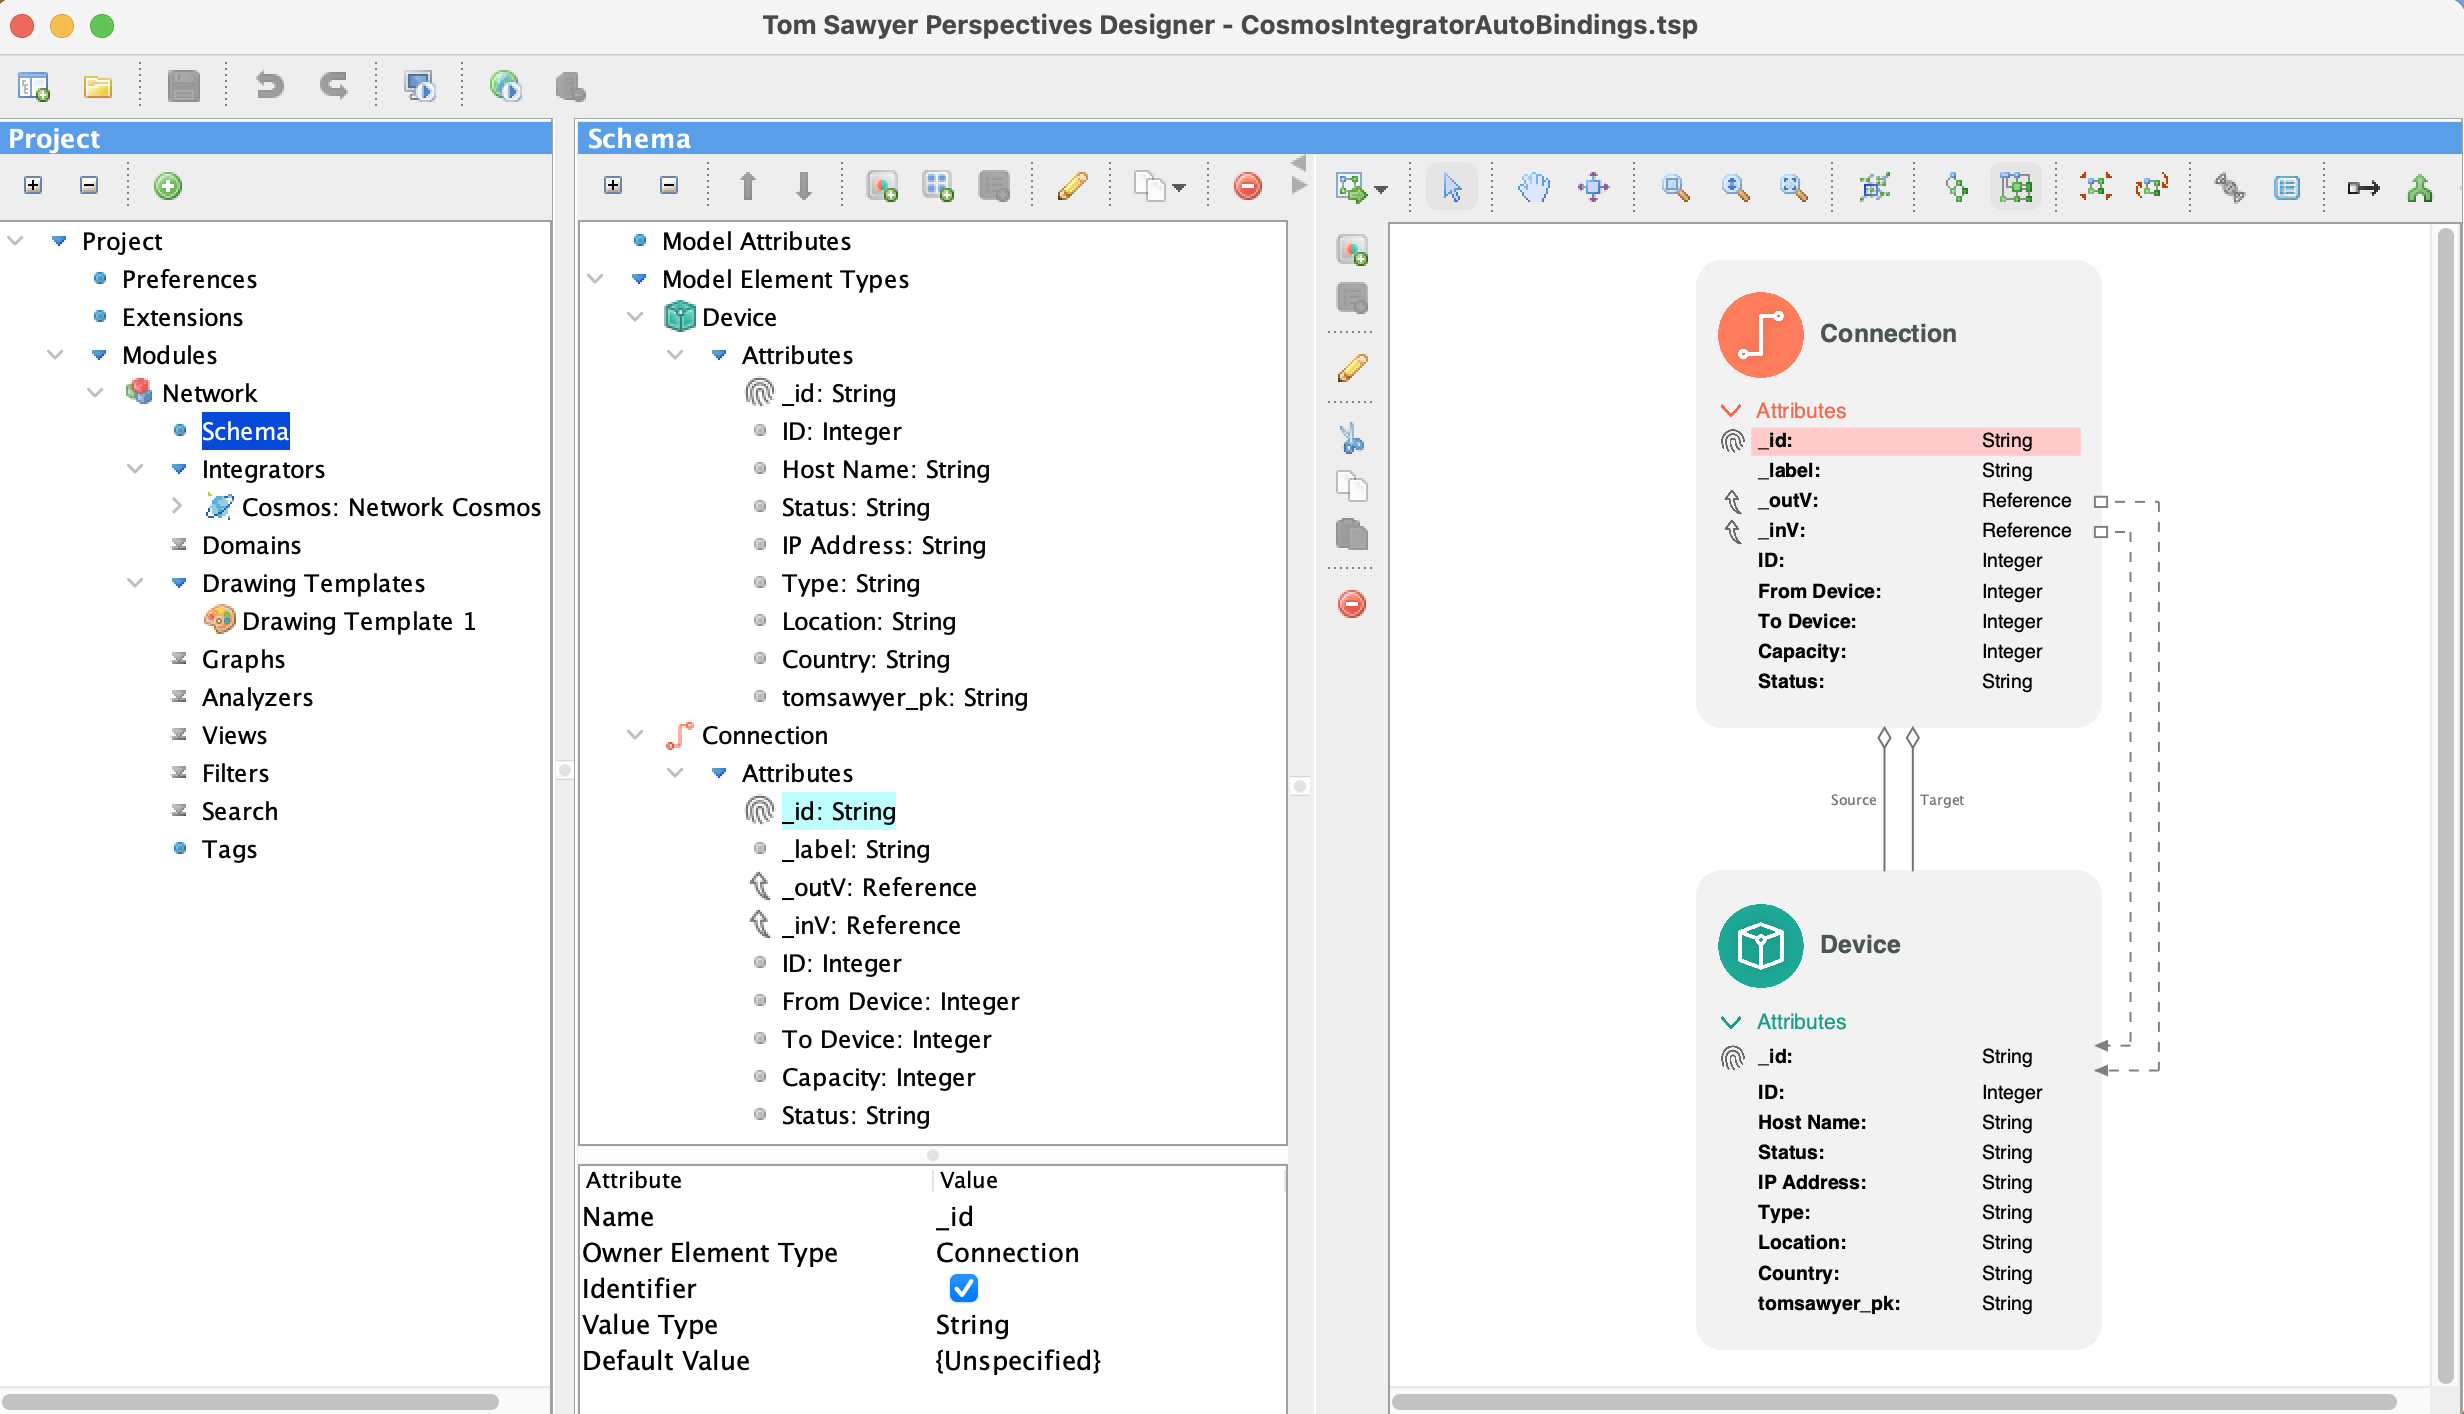
This feature gives exceptional flexibility to a host of users. RDBMS users can treat everything as a node and get an experience very much like a traditional SQL browser. Graph database users can more easily take advantage of the graph concepts they built into their data. Or anyone can take some of column A and all of column B.
Storing Models as Graphs
To further align with the graph-as-model approach, Perspectives now implements schema as a graph model. Understanding the graph-based problems that users are encountering, the Perspectives native graph in-memory model takes advantage of the nature of the graph-based database, even for non-graph databases.
Designing Modern Graph Visualizations with Updated APIs
To make the most of your model, you need to be able to exercise its graph nature. A few new expressions and functions in the Perspectives expressions API will help.
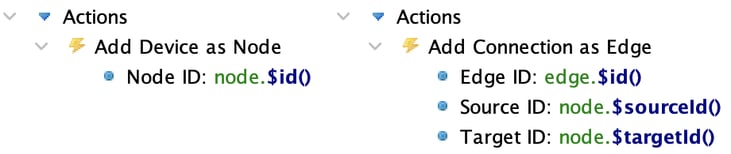
First, the Perspectives in-memory model element now features an identifier accessible via expression. The system ID for model elements, accessed by $id(), is a UUID automatically created for each model element upon its creation. Since every element in the model has a unique ID, this provides a way to find these elements in the model. Perspectives saves time and potential errors by automatically creating these unique names. When an element needs to know "Who am I?," Perspectives uses $id() and finds the name easily.
Secondly, if an element is an edge, you can now use $sourceId() and $targetId() to easily find attached nodes. While these IDs will be helpful when debugging your code, they can do so much more. $sourceId() and $targetId() make it possible to traverse the graph much more easily. Since this connectivity is so conveniently exposed, you can map and model your data and see connections much more quickly.
Finally, the new $source() and $target() lookup functions will help you pull attributes directly from the source and target elements. They essentially discover any attributes that are connected at the ends of an edge. This makes traversing big data far faster and much, much easier.
Try Perspectives 10.0 Now
These enhancements to the building blocks of Perspectives applications unlock a slew of capabilities that will help you design and develop your graph visualization applications. Try them out now!
Existing users can simply check their e-mail and use the provided link to access our Download Products page. After signing in, follow the prompts to download the latest version. You can find additional information in the Upgrading section of the documentation.
New users can request a free trial. You’ll receive our software and complete product documentation.
About the Author
Joshua Feingold is the Chief Technology Officer at Tom Sawyer Software. He's a Software Architect with experience providing solutions for customers across the spectrum of public and private, large and small, and technical and conceptual. He brings curiosity, an open mind, and a strong background in mathematics, engineering, software, and social and physical sciences to bear on the hardest problems facing modern organizations. He holds a Bachelor of Science in Mechanical Engineering from Caltech.
Submit a Comment