
Kristin Petersen
Content Manager
We can’t quit you, baseball! The season might be over, but we want more. So, we’re dipping into the baseball data to see what else we can learn. Read on for one more run around the bases!
Put Me In, Coach
This season, all anyone talked about was home runs. There were 6,770 homers hit during the regular season this year. That’s 665 MORE than the previous record! And exactly half of the teams in the league set franchise home run records. Holy homer!
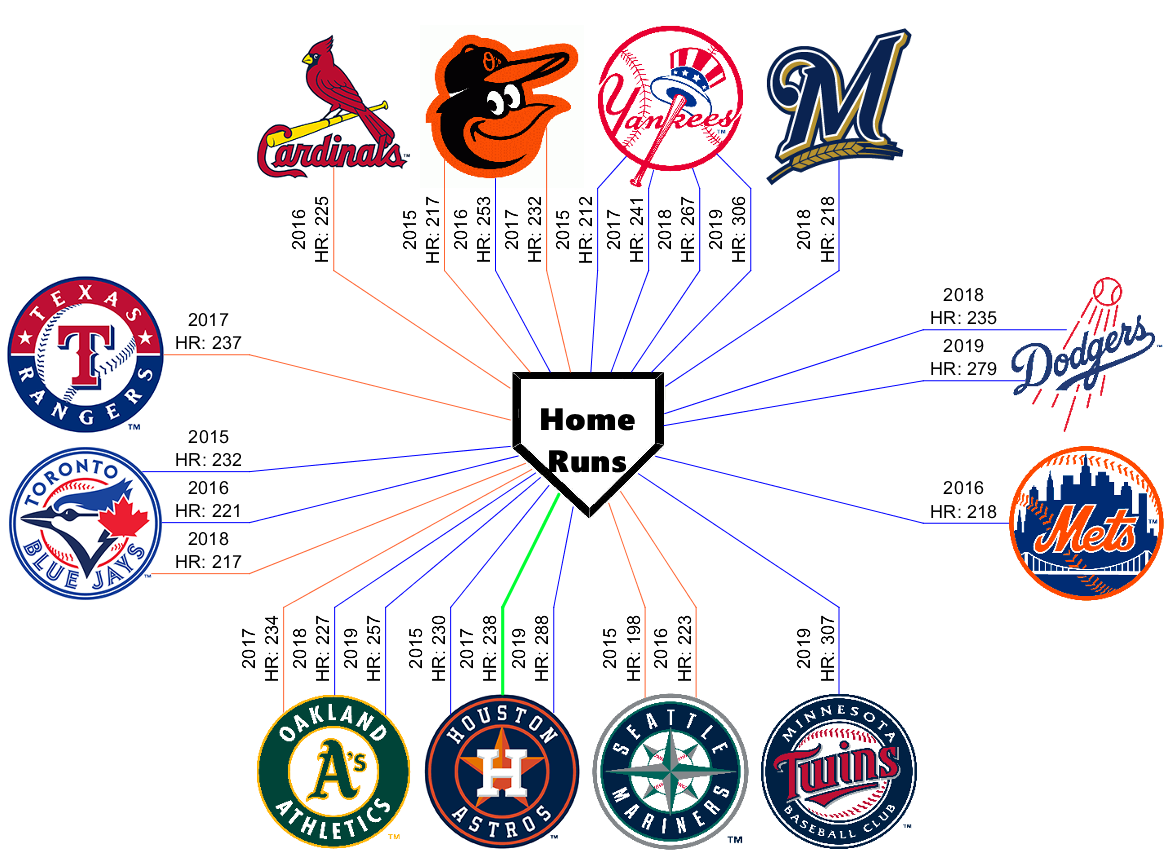
But, do all these home runs lead teams to the playoffs? We looked at the past five years (2014-2019), pulling the top five teams for home runs in each year. Edge colors indicate:
- Blue Edge: Appeared in playoffs
- Green Edge: Won the World Series
- Orange Edge: Neither won nor appeared in the playoffs
Here’s the result:
How do other stats affect a team’s success? To find out, we layered in Earned Run Average (ERA), Strikeouts (SO), and Runs Batted In (RBI) one by one.
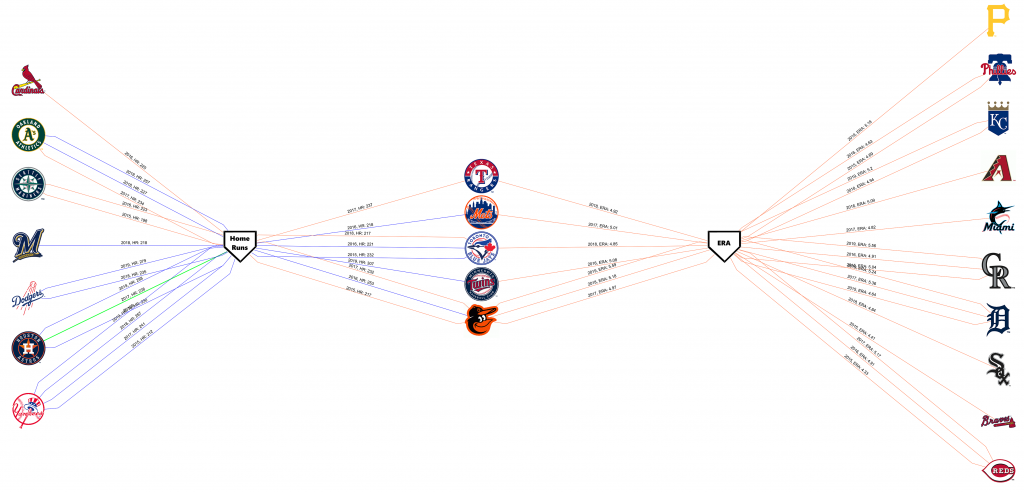
Each of these graphs used separation constraints to pull the statistic nodes (home runs, RBI, ERA, SO) away from each other.
Each of these graphs used separation constraints to pull the statistic nodes (home runs, RBI, ERA, SO) away from each other. This adds a customization layer to the standard symmetric layout. In Tom Sawyer Perspectives Designer, a spacing specification in the Model Rule forces the layout to pull a team that is connected only to a single statistic closer to that statistic node. For a team connected to two statistic nodes, the pulling happens in both directions and the team node displays in the middle of the two statistic nodes. Likewise, a team that is connected to multiple stats displays in the middle of the whole graph. By experimenting with the distance between statistic nodes, we can generate a drawing that clusters teams based on the number of nodes to which they connect.
Earth’s Favorite Pastime
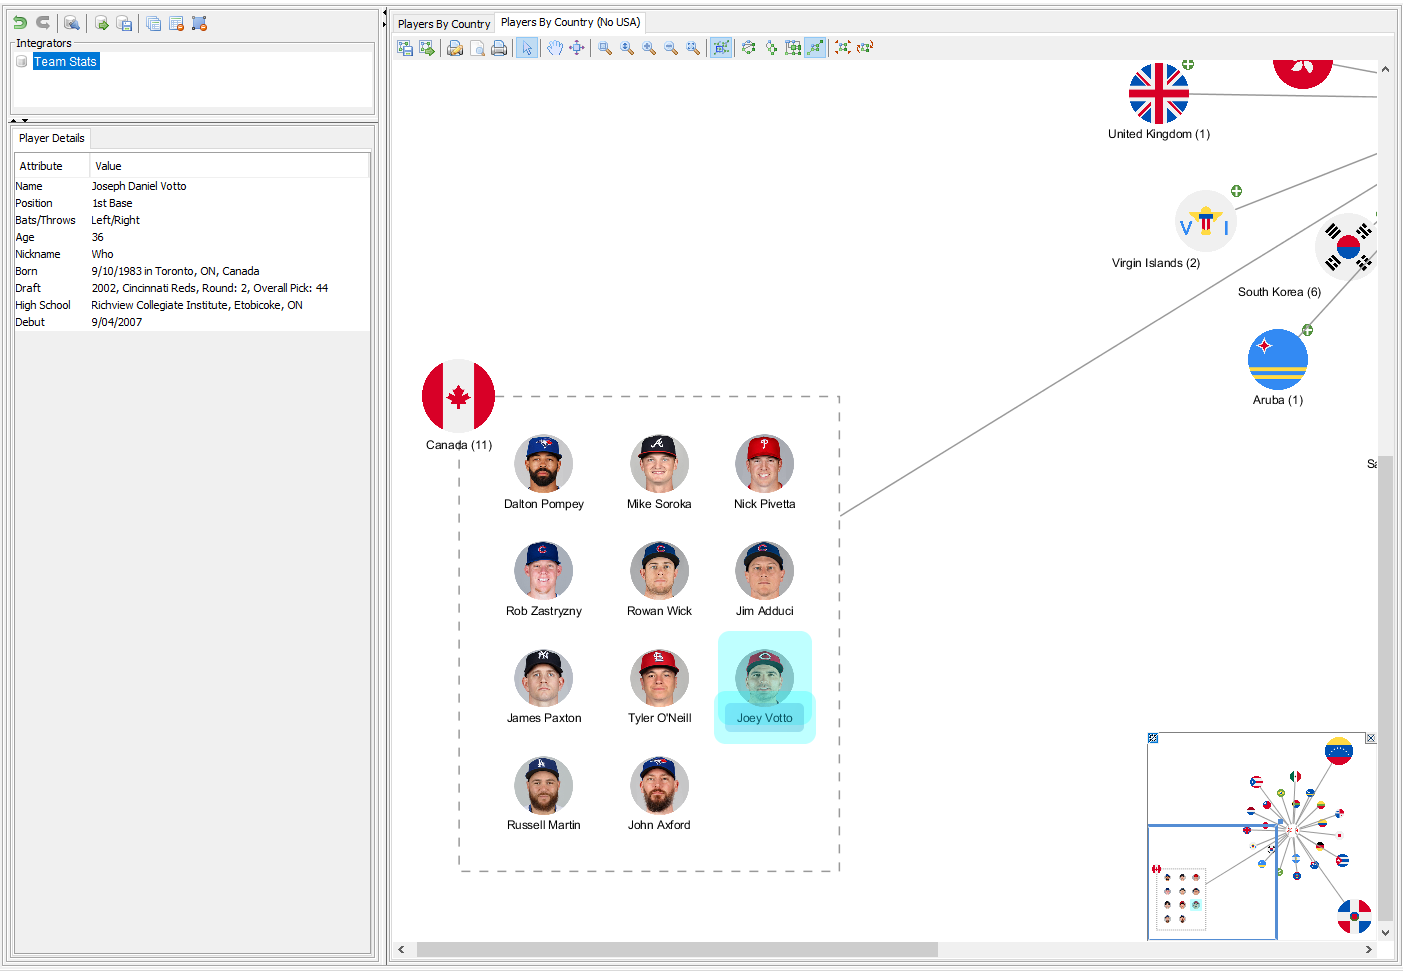
For fun, we used our data to see where MLB players were born. After removing the United States (but including Puerto Rico), this was the result:
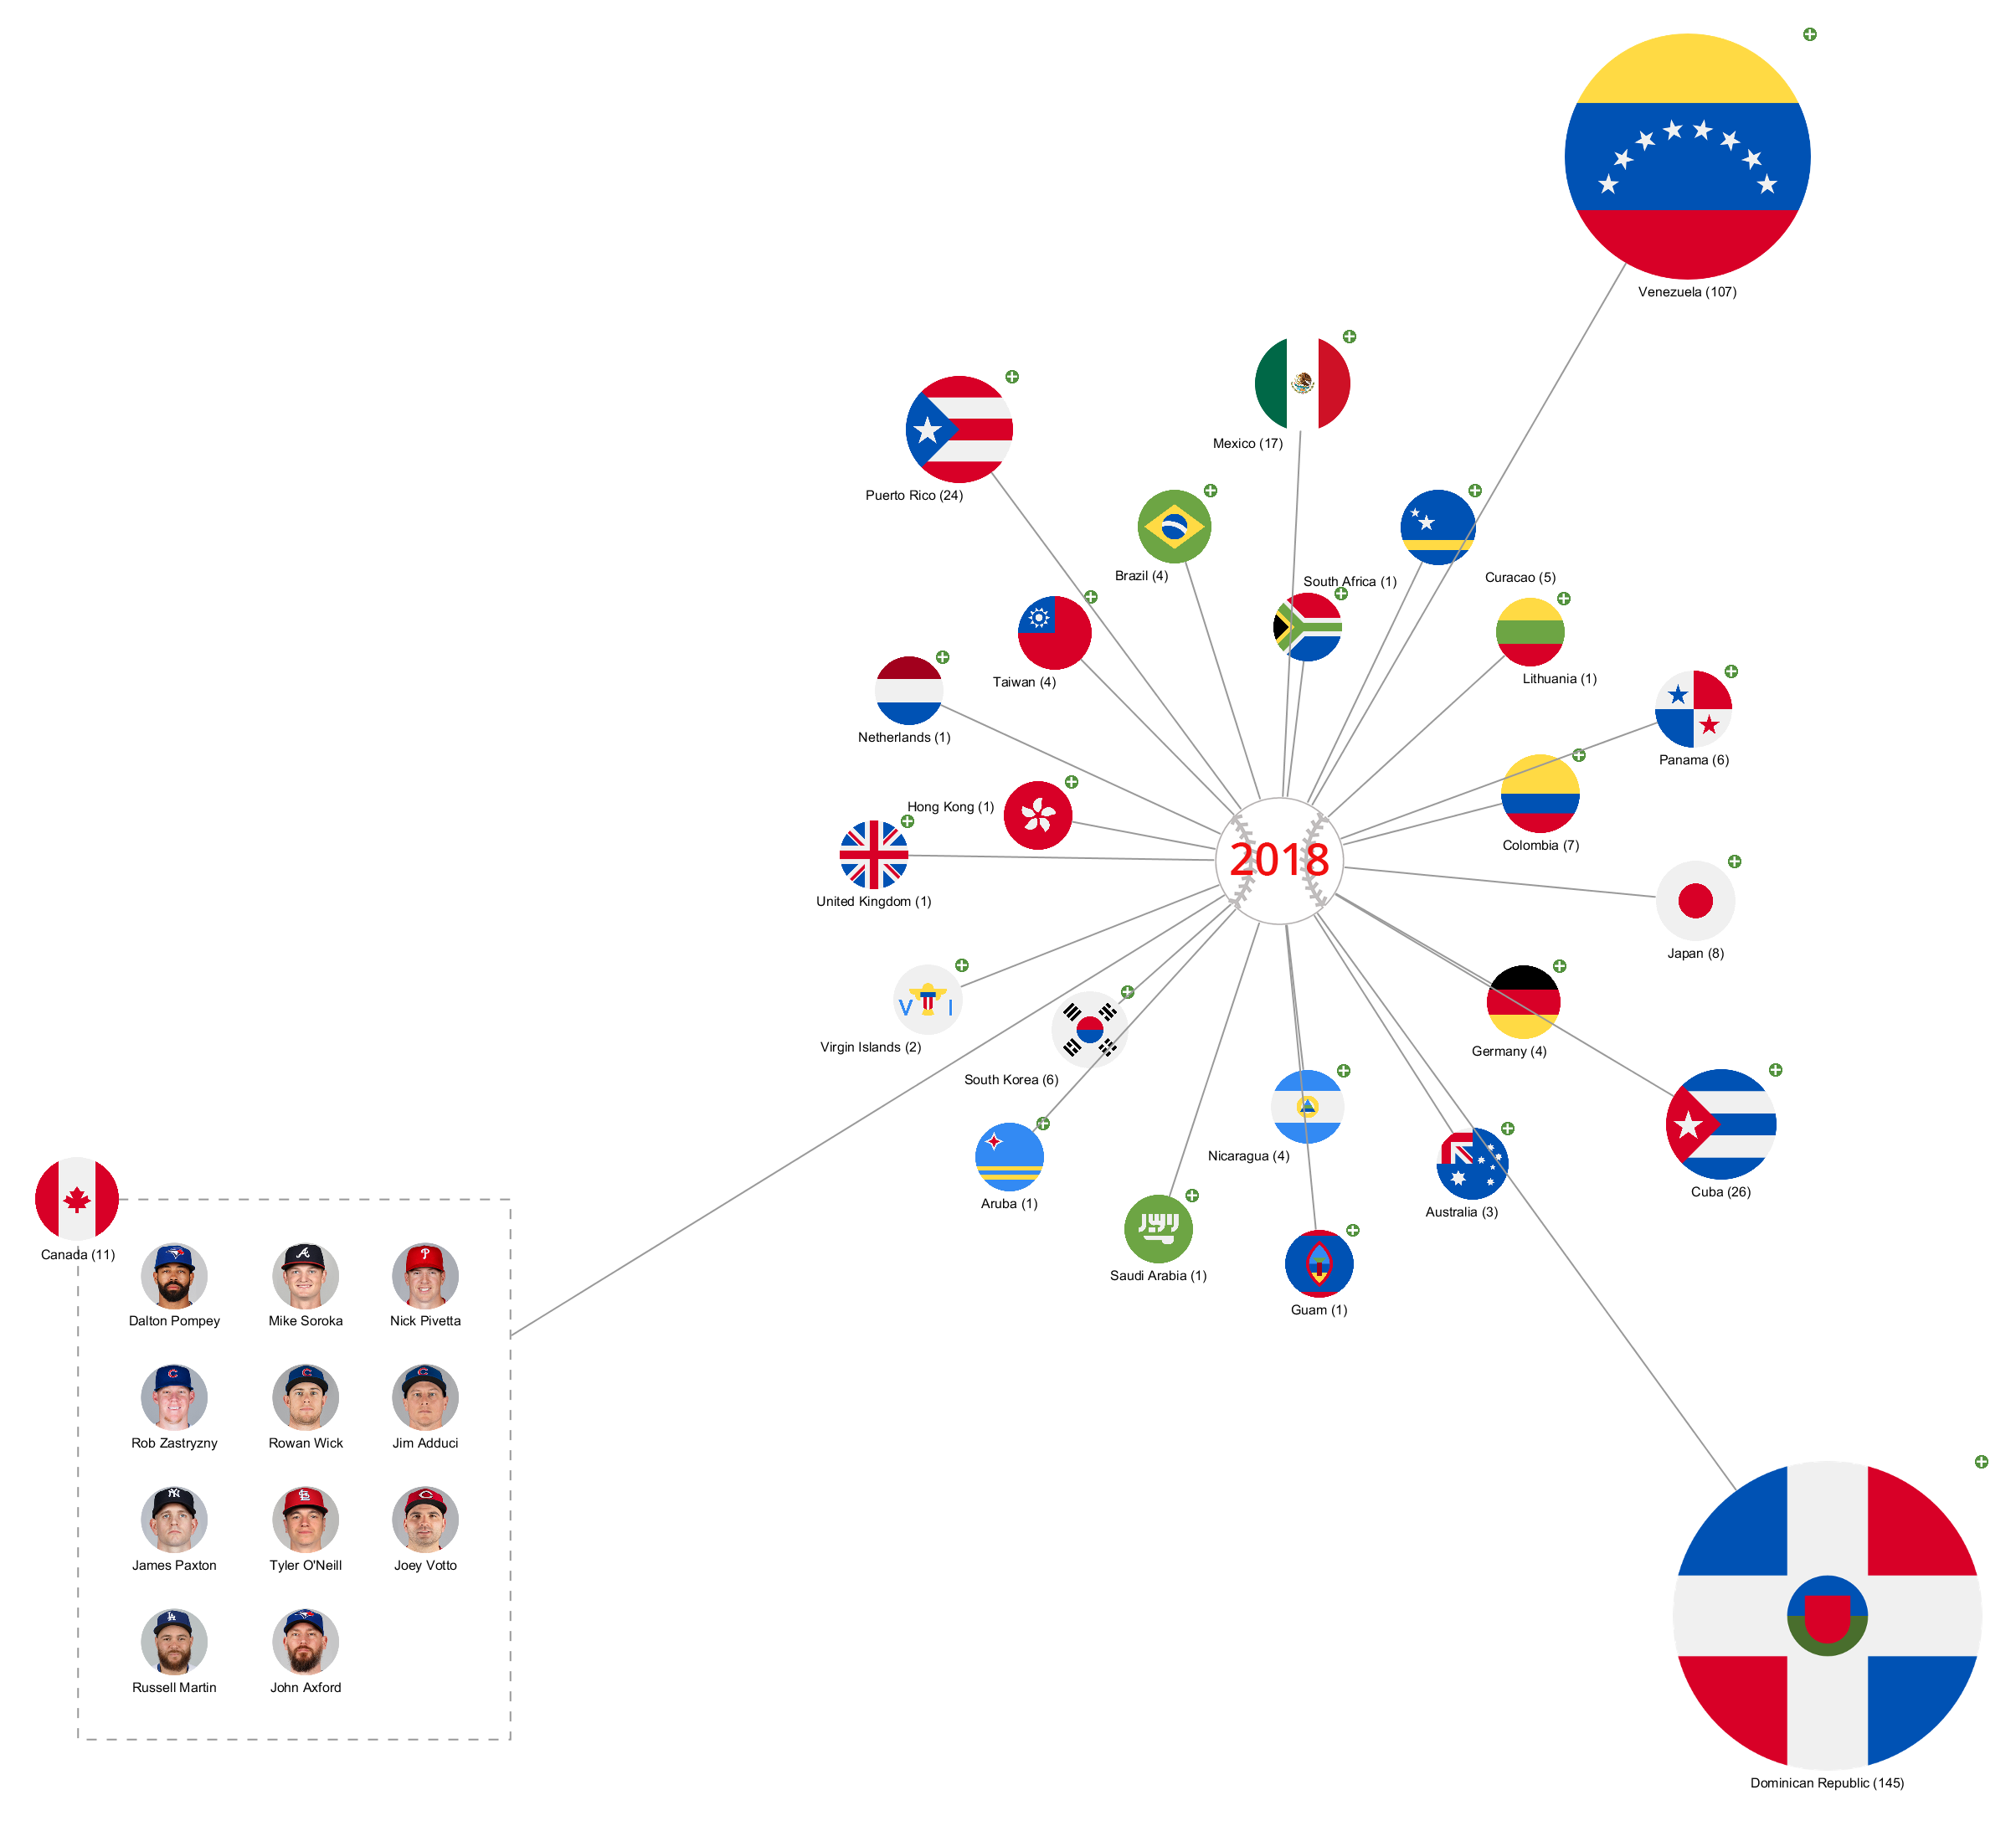
We applied a node drawing template to change the node width and height depending on how many players are from each country. This caused the nodes to grow based on the number of players. For additional detail, we expanded the Canada node to show each of the 11 Canadian-born players in the league last year.
We can provide even more information by including an inspector panel to the left of the drawing view, which displays additional stats on a selected node. To help with navigation, we also added a graph overview in the lower right corner that shows a thumbnail of the entire graph.
Armchair Analysis
With the orthogonal layout of the home run graph, we can easily see that of the 21 teams in the top 5, only 2 won the World Series. However, since only 3 teams did NOT make it to the playoffs, home runs do seem to be a big factor in a team’s overall season success.
Adding in ERA adds interest only in that it doesn’t seem to matter. Our graph shows that in the past five years, no team that performed in the top five for ERA even made it to the division playoffs. Can teams stop worrying about their ERA?
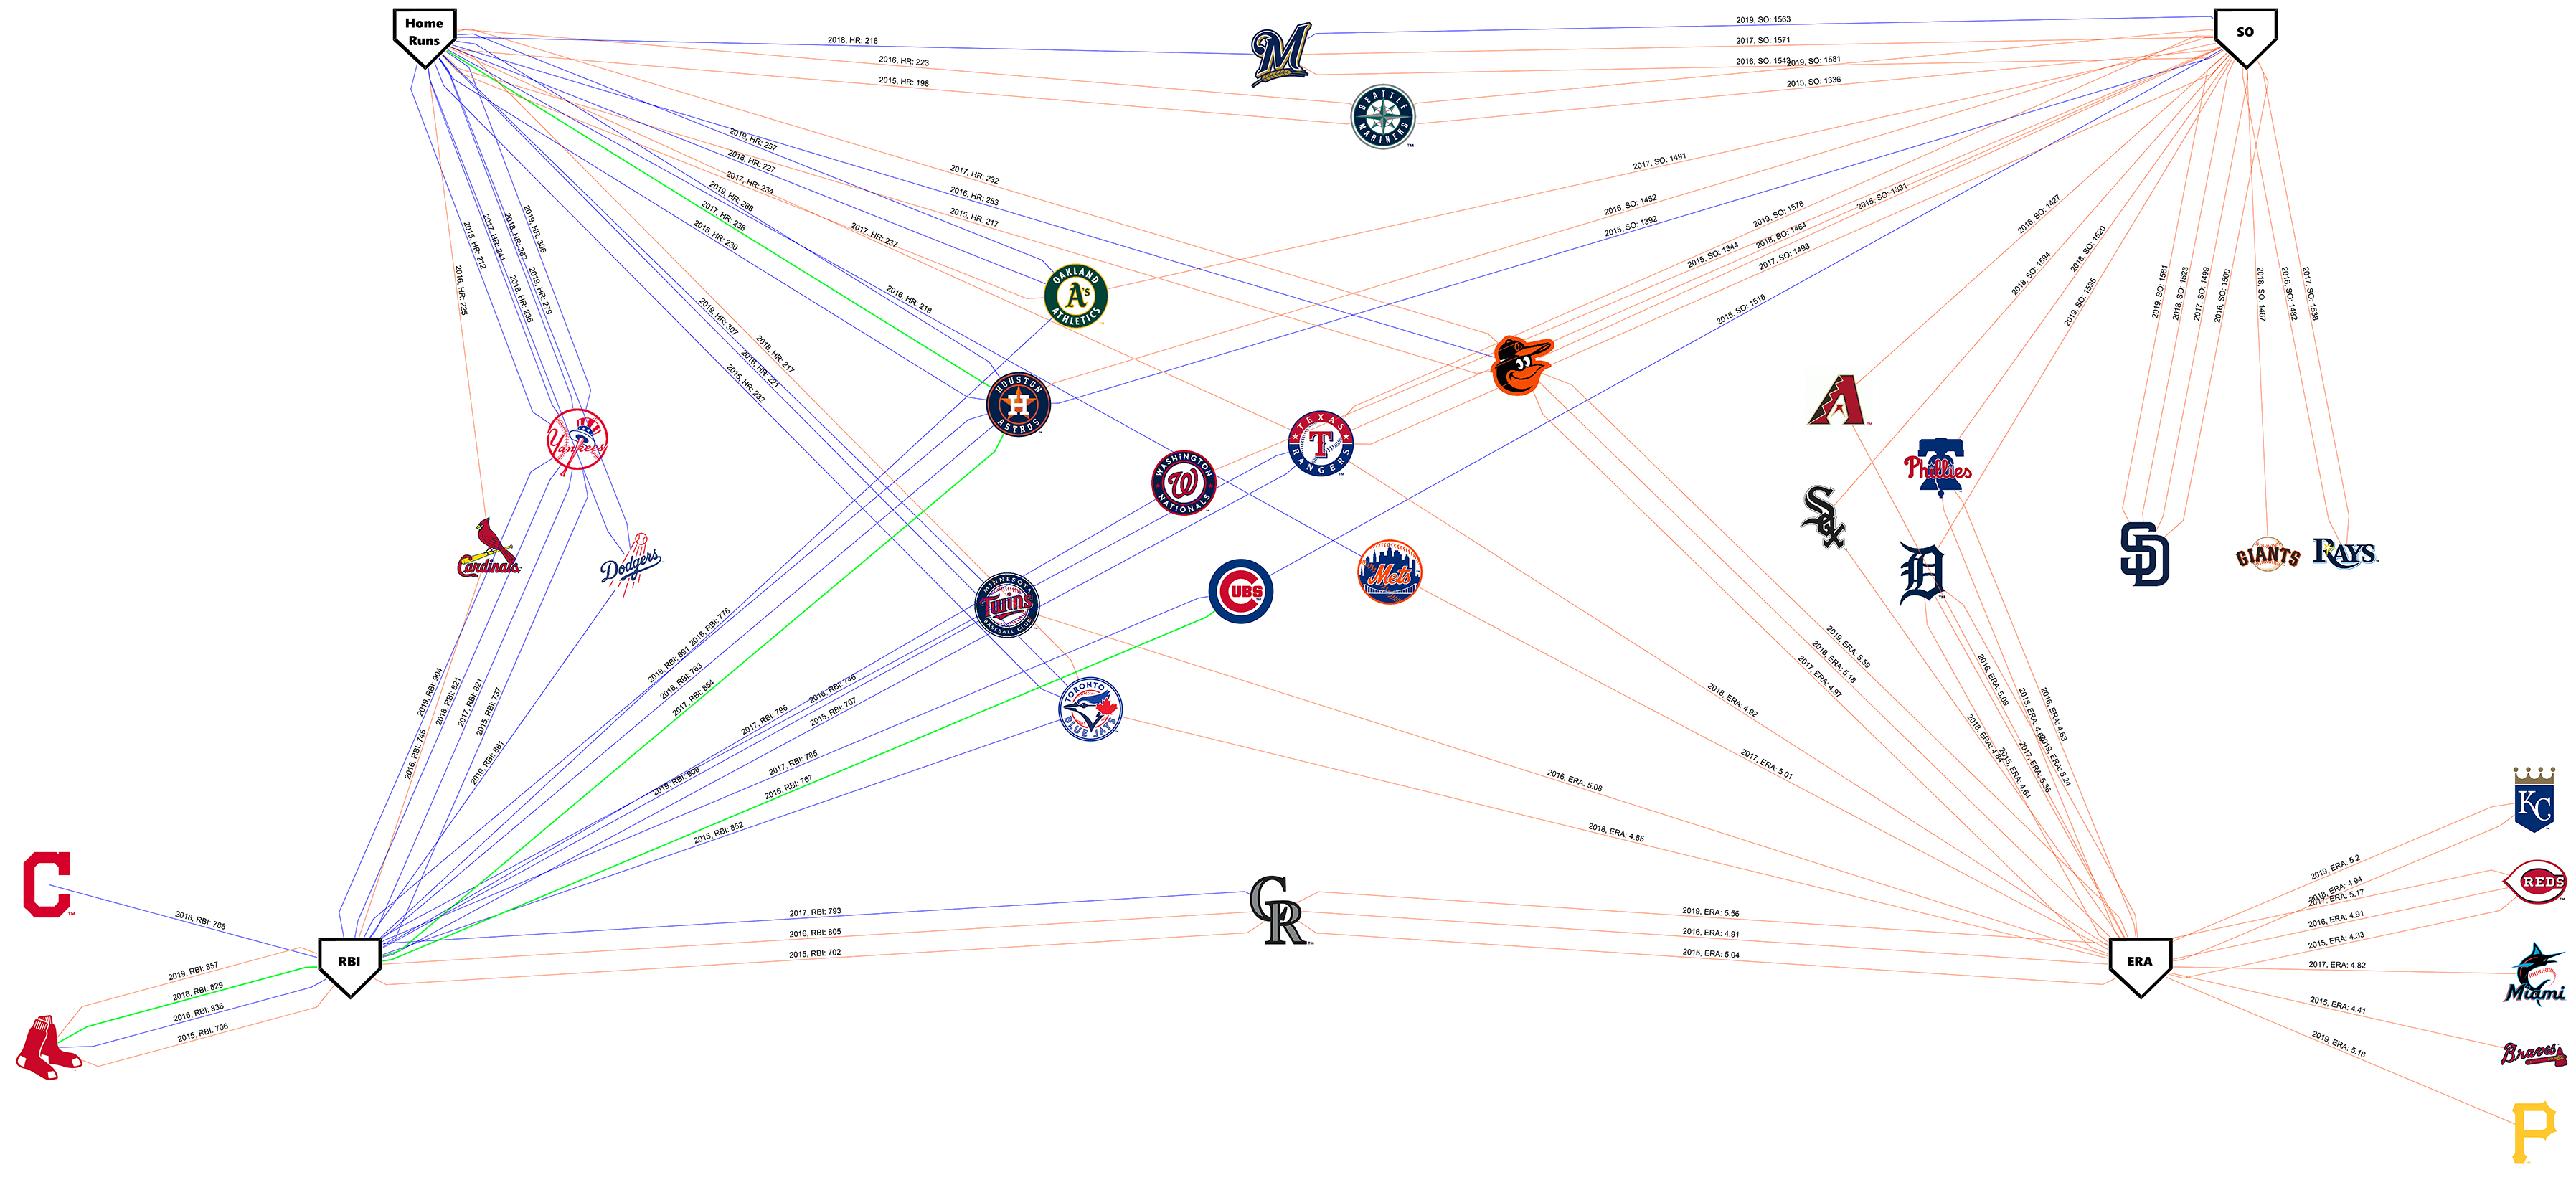
Things perk up when we add in SO. The A’s, Astros, Mariners, and Brewers are being pulled between the home run and strikeout nodes, meaning they have consistently put up good numbers for both. We can also see several playoff appearances and one World Series win in this cluster. The same can’t be claimed by the Rangers and the Orioles. Both teams display in the center of the graph, meaning they performed well in all three areas. Yet all connected edges are orange except the 2016 playoff appearance by the Orioles. Why doesn’t high performance in these areas lead to season success?
Finally, the most striking observation of the final 4-stat graph is the overwhelming amount of orange on the right half. When visualized this way, with orange edges denoting that the team neither won the World Series nor went to the playoffs for that year, SO and ERA seem wholly insignificant. So are they?
One thing is certain: we didn’t notice any of these things until we visualized the data in a graph.
Ready to visualize your own data? Get started with Perspectives now!
About the Author
Kristin Petersen is the Marketing Content Manager at Tom Sawyer Software. She has 17+ years of technical writing and editing experience in both the public and private sector, and transitioned into Marketing where she brings her strong technical background, writing experience, and creativity. She earned her Master of Science in Technical Communication from Drexel.
Submit a Comment