I recently learned about Dr. Ioannis Tollis’ impressive career in graph analytics and computer science. He is a pioneer in graph analytics technology, and a Professor at the University of Crete. Dr. Tollis, Ph.D., spoke with us about exciting developments and trends in the field. Read on to find out more.
You’ve been a leader in the global graph analytics technology community since before it hit the mainstream. What are some of the trends you’ve noticed over time?
There are many trends in graph analytics technology that appeared in the past. Some have disappeared, while others are still with us today.
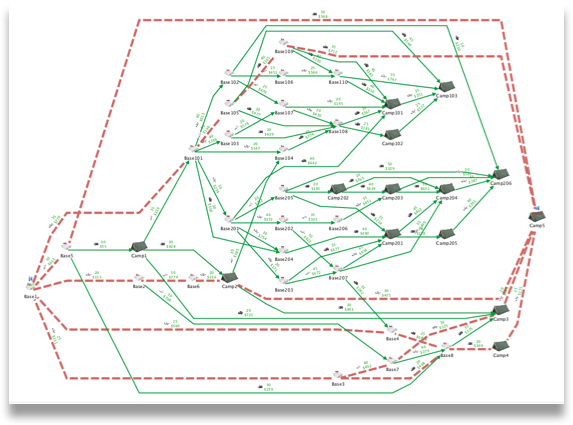
The most recent graph analytics technology trend deals with large or huge graphs. This trend comes from the new applications like Facebook and Twitter, as well as big data, social networks, and more. The rise in this trend is due to the existence of a large amount of data that people are trying to figure out how to mine.
Another trend that’s emerging concerns the issue of time-complexity, especially now that the graphs are much bigger than before. For example, spring embedders are notoriously slow. Researchers have tried to come up with faster ones, but no algorithm can deal with today’s graph sizes. So we attempt to attack the problem from a different point of view in order to have fast results.
This brings us to interactive graph drawing, which was central to research from 1995 to 2000. Now, it comes to the forefront again due to the large size of the graphs.

Another important graph analytics technology trend is labeling, which was relevant 15 years ago. Today, it continues to be critical to the user experience. User studies (i.e., how users perceive given drawings) are an important recent trend.
And of course, with the new switch to graph databases, graph analytics technology overall will become central again—it’s just a matter of time!
Why is graph analytics technology suddenly so hot?
Graphs are all around us. They exist everywhere such as Facebook, Google, Twitter, telecommunications, biology, medicine, marketing, and the stock market. And of course, they affect a multitude of areas within computer science, including software engineering, databases, and the design of integrated circuits.
We use graphs as a way to represent data (or entities) and the connections that exist among them. Many people in the marketplace have known for some time now that data is an incredible resource.
In the business world, the upper management of many companies are realizing that they can leverage their data in order to grow their business. To help visualize their data and take action on important insights, they’re now relying on graphs to make that happen.
What’s your claim to fame in the world of graph analytics technology and visualization?
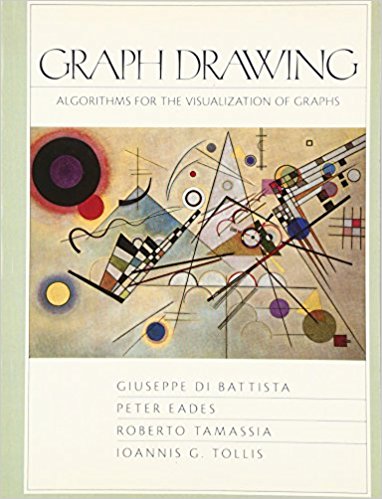
I’m one of the authors of the first book on Graph Drawing and another well-known research paper that pulls together theoretical and application-oriented research from various sources on easy-to-read graphs and charts, titled “Algorithms for Drawing Graphs: an Annotated Bibliography.” I have also coauthored nearly 200 articles, chapters, and books about the general area of graph drawing or layout, visualization, and analysis.

In addition to writing and research, I’ve organized, chaired, and co-chaired numerous international symposiums and conferences on Graph Drawing. I am also one of the founding editors of the Journal of Graph Algorithms and Applications, and I’ve served in editorial positions of several other journals.
As of November 2017, Google Scholar shows that my scientific work has received more than 8500 citations, resulting in an h-index of 40. This score ranks my work as “outstanding” for productivity and impact in the scientific publications world.
In the past I partnered with Brendan Madden, Chief Executive, Tom Sawyer Software, to submit a proposal to the National Institute of Standards and Technology (NIST) Advanced Technology Program on graph visualization technology, which received $2 million in research funding.
In 2000, Tom Sawyer Software received the U.S. Patent Number 6,091,424 Titled “Labeling Graphical Features of Drawings,” which I helped author, along with Tom Sawyer Software CEO Brendan Madden, and Professor Konstantinos Kakoulis.
Do you have any predictions for graph visualization and analysis in the year 2020? It’s not that far off.
As we discussed before, the main challenge in the area of graph visualization and analysis is the fast-growing size of graphs.
For example, the Facebook graph has several billion nodes and over one trillion edges. How do we deal with such a humongous graph? What do we need to analyze it? What do we visualize?
It’s clear to me that graphs will be more central to most big data applications. We are already seeing that with the projects Tom Sawyer Software works on.
Graph visualization will be a must for data analytics. Why? It will be impossible to extract patterns and discover trends from the data without giving users tools to see into and navigate the data. For such interactions “a picture is worth a thousand words.”
Therefore, graph visualizations will be a “must” in most intelligent systems, and interactive visualization systems will be the key.
About Dr. Ioannis “Yanni” Tollis
Dr. Tollis is a professor of computer science, and former Director of the Center for Information and Communication Technologies, and Director of the Data Processing Laboratory at the University of Crete in Greece (2013-2017). Prior to that he was the head of the Biomedical Informatics Laboratory (BMI lab), within the Institute of Computer Science at the Foundation for Research and Technology in Greece (FORTH–ICS), from 2005 to 2010. Dr. Tollis received his Ph.D. degree in Computer Science from the University of Illinois at Urbana-Champaign in Jan. 1988. He joined the faculty of The University of Texas at Dallas in December 1987, where he was a Professor of Computer Science until 2004, when he joined the UOC as Professor.
To learn more about Dr. Tollis or to contact him directly, visit http://www.csd.uoc.gr/CSD/uploaded_files/Tollis-CV-2016.pdf or find him in Google, google scholar, or researchgate.

Submit a Comment