We’re excited to announce the release of Tom Sawyer Perspectives 9.2.0. This version includes exciting new features like:
- OrientDB developers now have a dedicated integrator, saving coding time
- Developers can now use The Designer to configure whether the overall graph view zooms in when nested nodes collapse or remain at the same zoom level
- Improvements to incremental layout of disconnected nodes to better preserve the user’s mental map
- And more
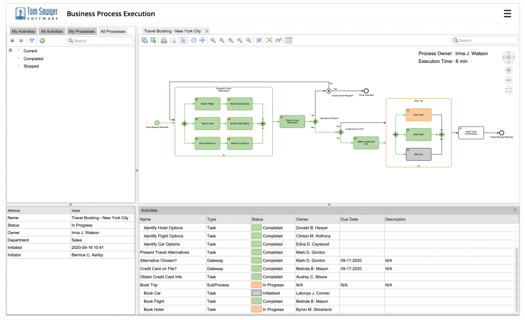
New Tables Views in Business Process

Ever wanted to combine the power of a Business Process graph visualization with the sorting power of a table? Welcome to the new Activity tables available in the Modeling and Execution modules. While our easy-to-follow diagrams show an overview of the whole process, the editable tables help you track activity status and update activities that require action. So handy!
Automatically Extract Schema from OpenAPI RESTful Endpoints
Creating a schema by hand can be a time-consuming task. Helpfully, Tom Sawyer Perspectives can extract schema from a number of data sources, including Neo4j, Amazon Neptune, Apache TinkerPop, Microsoft Cosmos Azure, SQL, Microsoft Excel, RDF, and structured text. Now, in Release 9.2.0, OpenAPI RESTful endpoints are included in that list. You can use the REST integrator to read the structure of your OpenAPI document and pull out the metadata information automatically.

For a quick walkthrough, try the REST Integrator tutorial available in the documentation. You’ll start a local RESTful API server, access the data stored there, and then incorporate it into a Tom Sawyer model.
Better…Stronger…Faster

In addition to providing new features, we’re always trying to kick up performance and this release is no exception. With 9.2.0, you’ll see the following performance improvements:
- Improved integrator performance by up to 28%
- Reduced integrator peak memory usage by up to 10%
- Improved drawing view update performance by up to 8%
- Reduced drawing view update peak memory usage by up to 7%
- Improved tree view update performance by up to 14%
- Reduced tree view update peak memory usage by up to 7%
- Reduced rendering peak memory usage by up to 4%
- Fine-tuned performance of a wide variety of frequently used SDK methods
- Improved results caching of the REST integrator
- Improved performance of topological sort
Create an Invokable View Dialog
Creating custom dialogs in Tom Sawyer Graph and Data Visualization just got easier! The improved functionality allows you to dynamically invoke a dialog box from the Designer containing a view and information about the graph. Additionally, you can add the Open HTML Dialog action item to a table view toolbar in an application, allowing end users to see information, confirm an action, or input information.

Want to write your own custom code for these dialogs? No problem. Corresponding JavaScript commands are also available for this new feature. See Open View Dialog and Open HTML Dialog in the References section of the documentation for JavaScript function parameters.
Upgrade Now
Existing users can simply check their e-mail and use the provided link to access our Download Products page. After signing in, follow the prompts to download the latest version. Additional information can be found in the Upgrading section of the documentation.
New users can request a free 60-day trial. You’ll receive our software and complete product documentation.
Enjoy! Reach out to us with any questions or feedback—we’re always happy to hear from you.
About the Author
Kristin Petersen is the Marketing Content Manager at Tom Sawyer Software. She has 17+ years of technical writing and editing experience in both the public and private sector, and transitioned into Marketing where she brings her strong technical background, writing experience, and creativity. She earned her Master of Science in Technical Communication from Drexel.

Submit a Comment