
Max Chagoya
Fraud and corruption affect the lives of millions of people by impacting the financial health of corporations and individuals. Fraud is typically carried out by multiple parties that, by their very nature, strive to remain hidden in plain sight. As a result, many industries have adopted fraud-detection solutions. Learn how Tom Sawyer Perspectives powerful visualization and analysis can help identify fraudulent activities including identity theft and network compromises.
Detect Fraud with Tom Sawyer Perspectives
Tom Sawyer Perspectives is a low-code graph and data visualization and analysis development platform that works especially well with graph databases. Integrated design and preview interfaces and extensive API libraries allow developers to quickly create custom, production-quality, visualization and analysis applications. With the Perspectives point-and-click Designer interface, users design and develop applications with custom drawing, map, chart, table, tree, inspector, and timeline views to gain insights into data federated from multiple sources.
Perspectives also provides best-in-class graph visualizations, analysis, and navigation using five automated layouts, swimlanes, nested drawings, and 30 built-in analytics, for a powerful user experience that cuts through complex data.
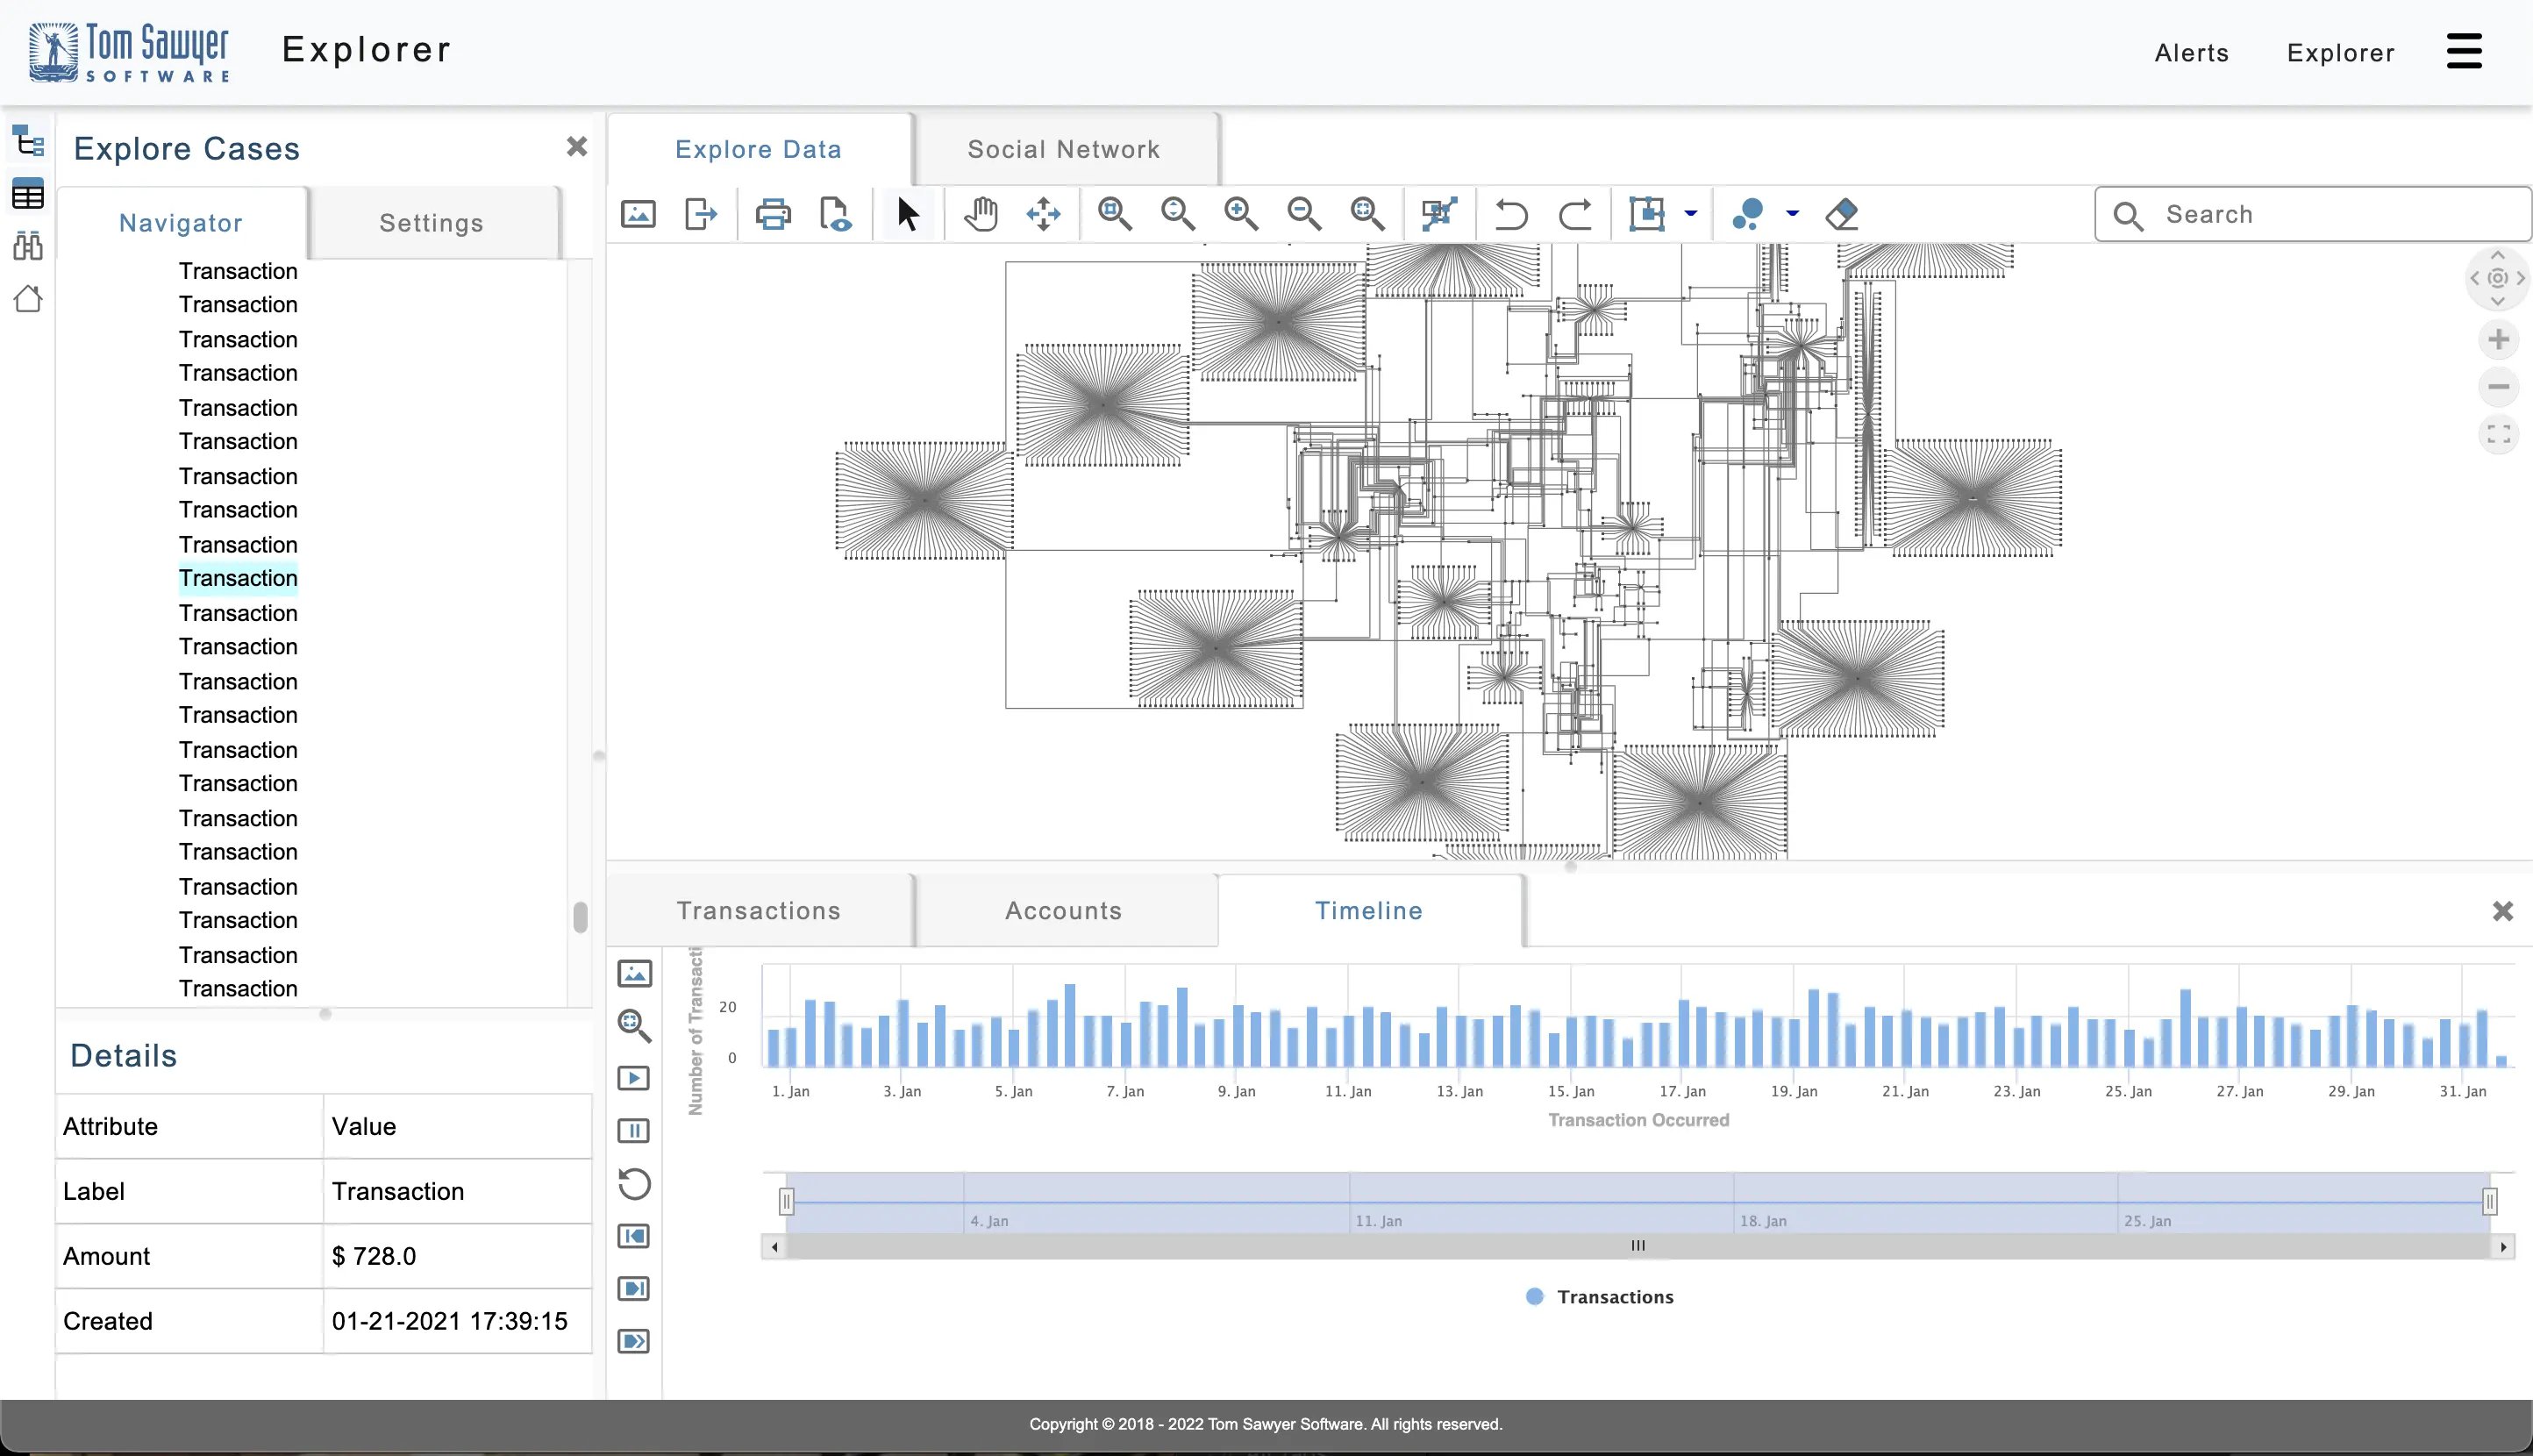
An example fraud detection application built with Perspectives.
Building the Fraud Detection Application
Let's walk through how to use Perspectives to build a fraud detection application.
1. Ingest the Data
The first step is to ingest data from your external database into the Perspectives data model. This example application uses the data described in “Building a Fraud Graph Application on Amazon Neptune.”
Note that this data was produced by our partner, AWS, specifically for experiments and demonstrations, and obtained from GitHub. To the best of our knowledge, the data is fictitious. However, we also obfuscated it to ensure that it doesn’t accidentally match personally identifiable information.
The schema for this fraud detection application includes the following elements and attributes:
| Schema Node | Description |
| Account | Account number and associated name. |
| Address | Location for account. |
| DateOfBirth | Date of birth for account holder. |
| EmailAddress | Email address for account holder. |
| FraudRing | List of accounts suspected to be in a fraud ring. |
| IPAddress | IP address associated with account. |
| Merchant | Business which conducts credit card transactions. |
| PhoneNumber | Phone number associated with account. |
| Transaction | A transaction initiated with an account at a merchant. |
| Schema Edge | Source Node | Target Node | Description |
| ACCOUNT | Account | Transaction | A transaction that happened on this account. |
| MERCHANT | Transaction | Merchant | A transaction that happened at this merchant. |
In Perspectives, you interact with the schema through a graph-based visualization. The following figure shows the schema from our example fraud detection application. A property graph represents the schema elements with nodes in green and detailed relationship information in orange. Attributes can be element values or references to attributes in another schema element. A model element can inherit attributes from one or more existing model element types as long as they have the same object model type.
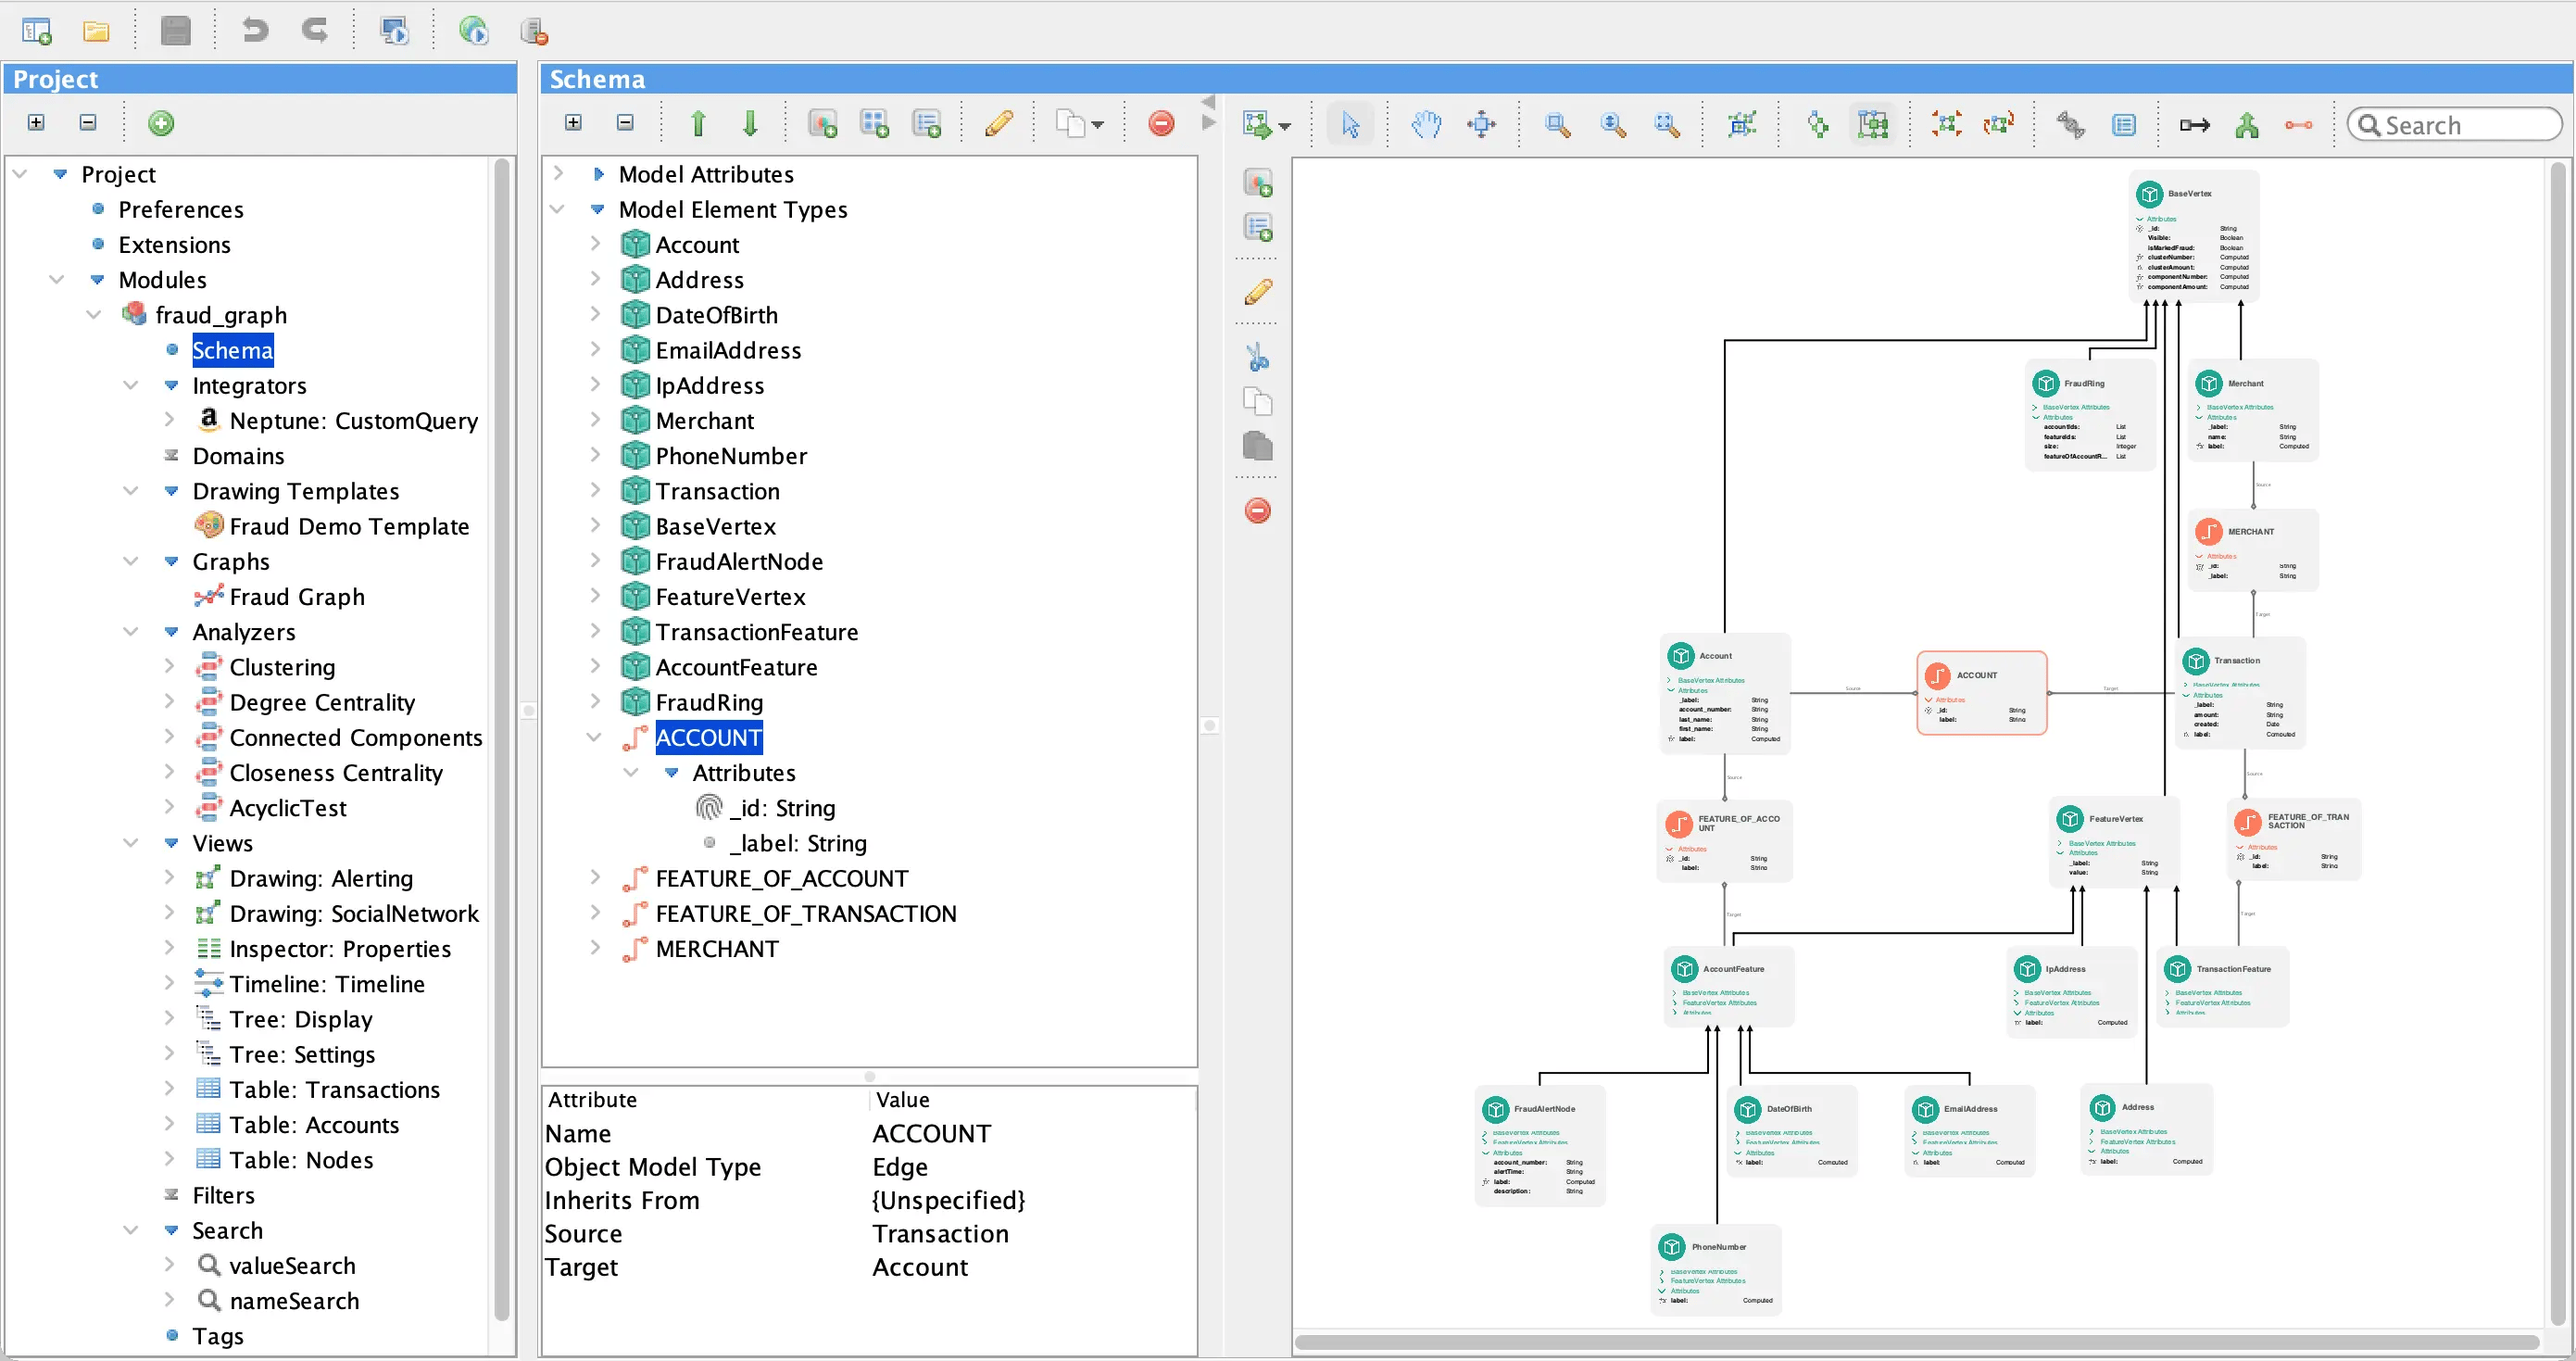
Perspectives Designer showing the property graph representing schema elements.
2. Add Fraud Detection Visualizations and Analysis
Now that the model is populated, you can add visualization and analysis views, which are powerful tools for fraud prevention. Together, visualization and analysis can improve response time in reacting to potential fraud and help prevent losses.
In Perspectives, a view is used to visualize and interact with the data models in the application. It consists of a view definition and its interactive behavior. The view definition specifies how a data model is represented in the view while the interactive behavior defines how users can navigate in the view and use it to manipulate the data model.
When using a drawing view, Perspectives specifies the appearance, behavior, and layout of the network drawing. There are five layouts: Bundle, Circular, Hierarchical, Orthogonal, and Symmetric. These layouts are data-driven and created automatically given the topology of the graph. Utilizing the low-code Perspectives Designer, you use rules to define the nodes and edges which are added to the drawing view, and how they should appear.
The following figure shows how to add nodes to a drawing view by defining which model elements should be represented with a node in that view, and how they should be rendered with colors, shapes, or images. Edges are added in a similar way.
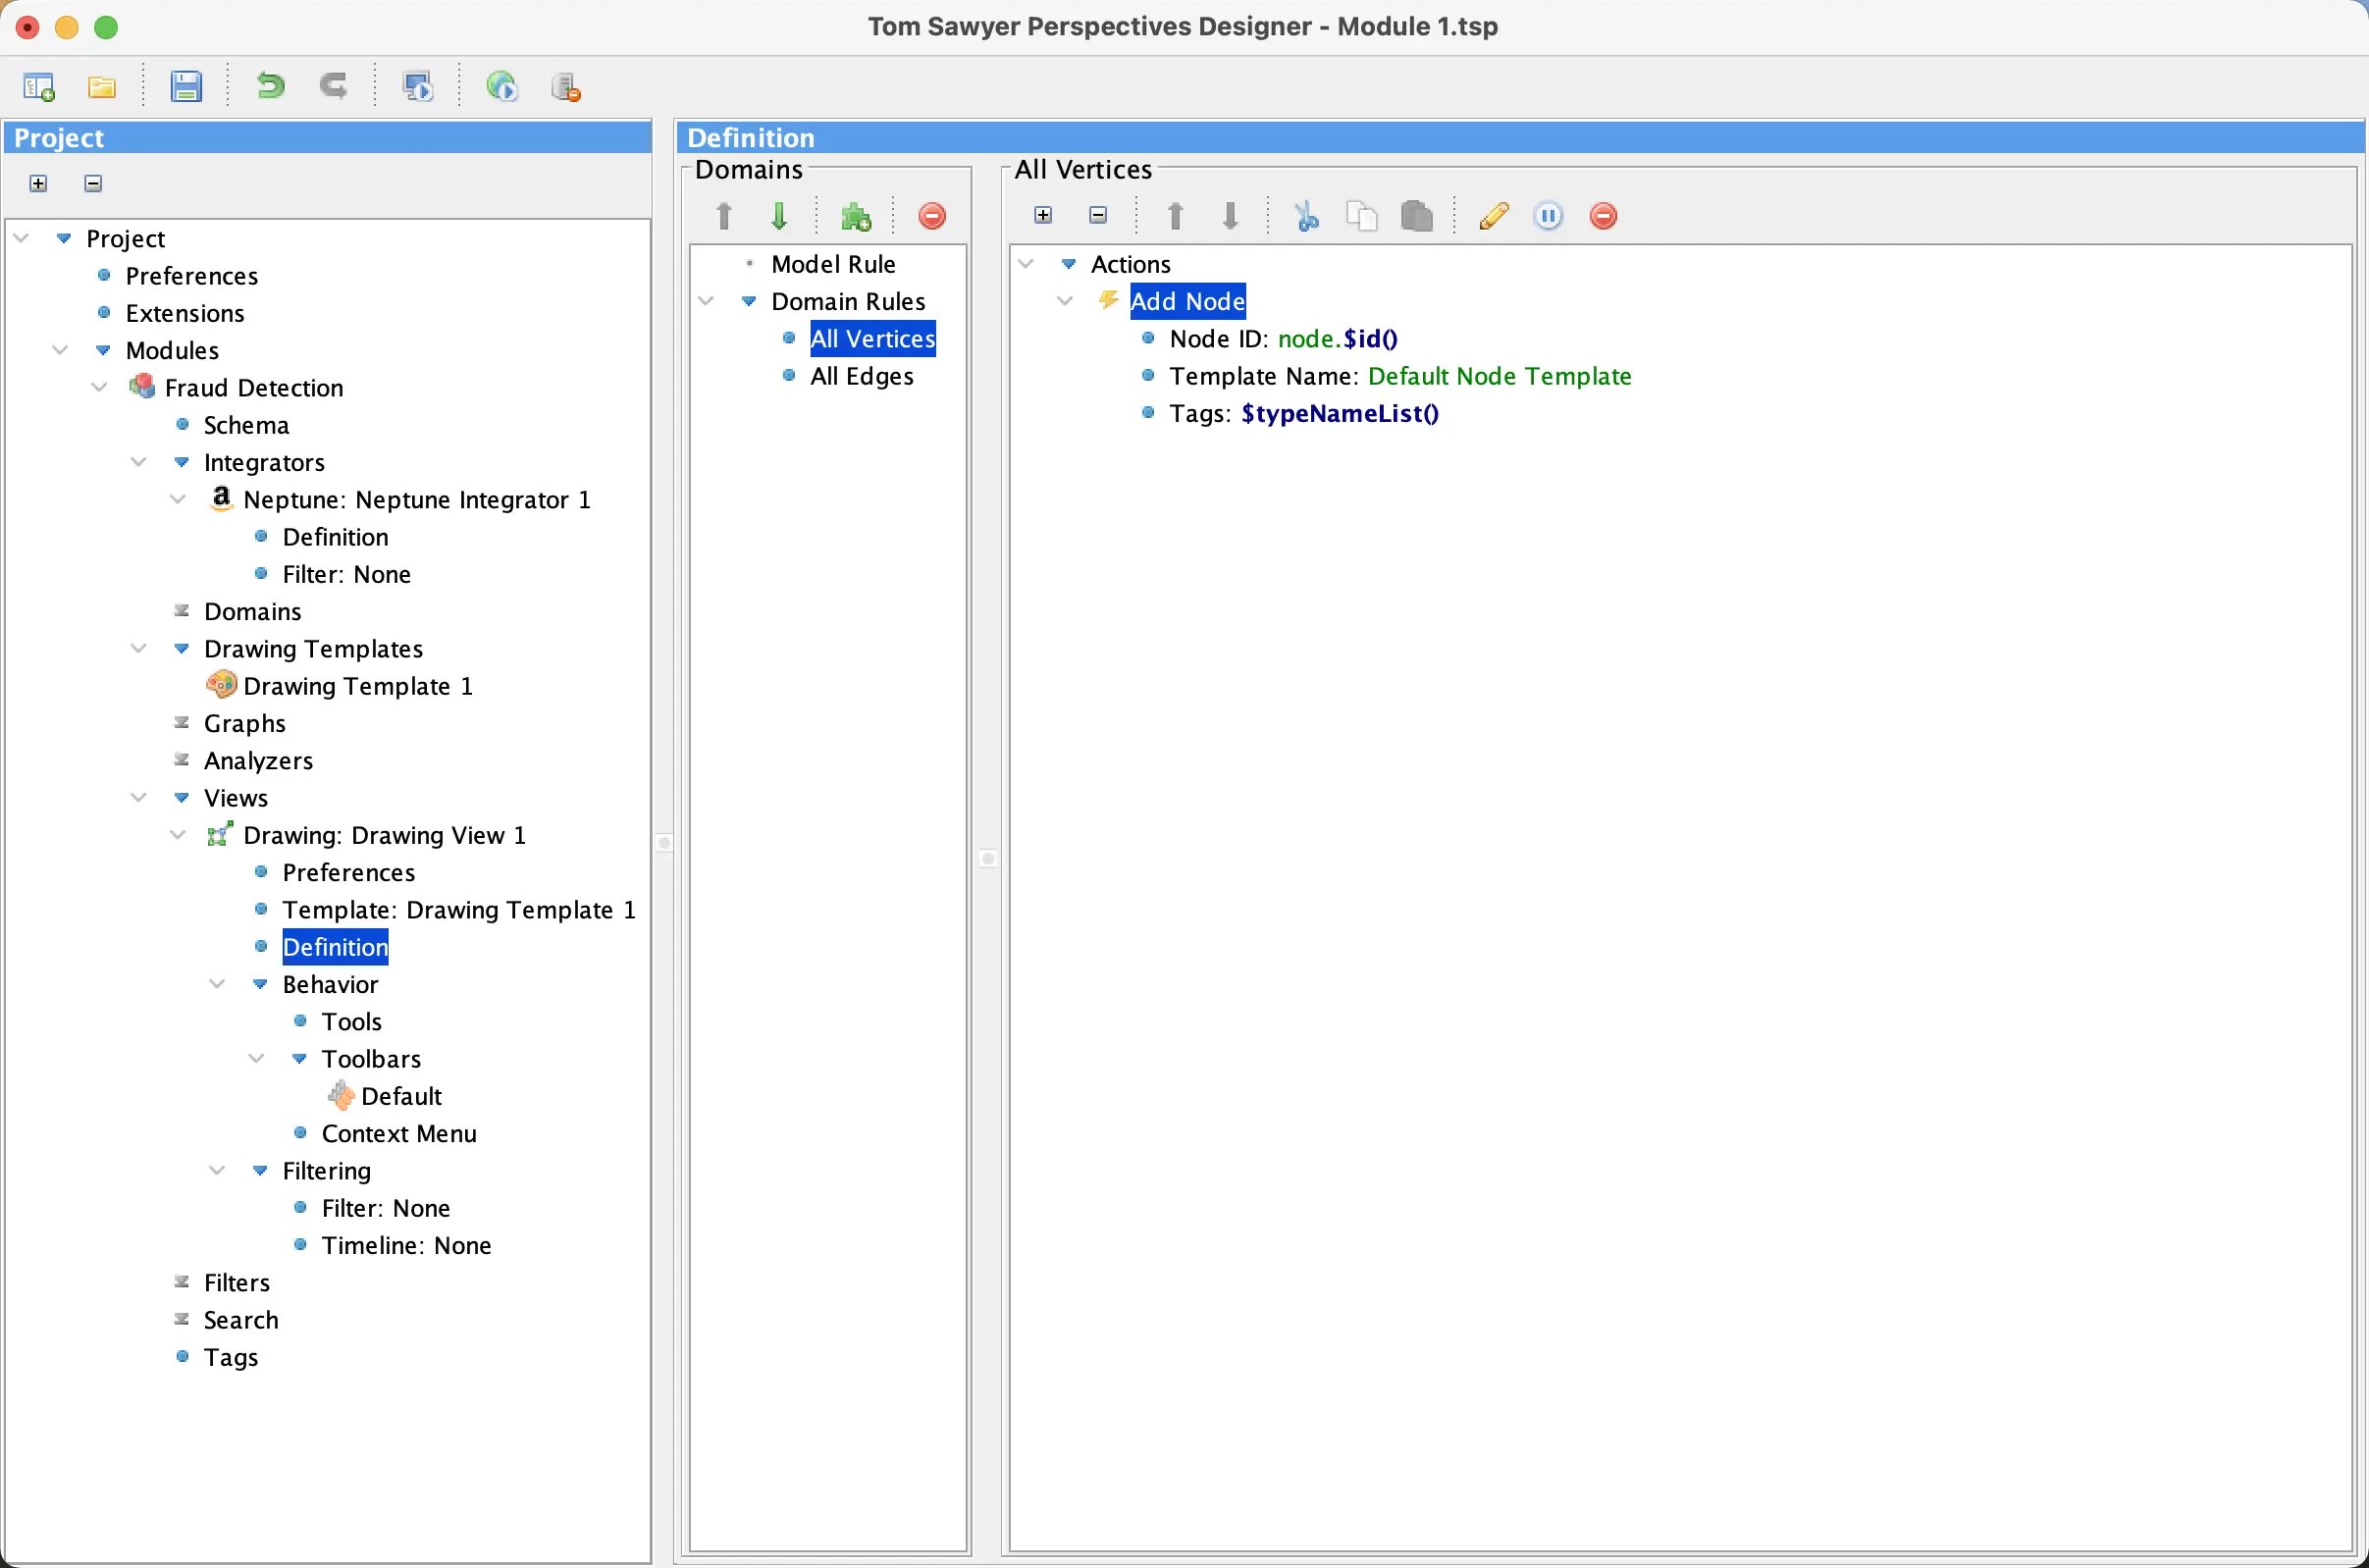
Adding a Drawing View in Perspectives Designer.
Once the additional drawing, table, tree, and inspector views have been added, you are ready to apply data analysis with powerful analytic algorithms built specifically for this task. Perspectives includes over 30 built-in algorithms for data-driven analysis. Some algorithms perform traversals and path analysis, detect or break cycles, and find dependencies and reachable graph elements. Others cluster or partition graph elements, conduct root cause analysis, perform network flow computations, or compute centrality measures in social networks.
This example application includes the following algorithms:
- Betweenness Centrality: This algorithm measures a node based on how many shortest paths the node is a member of. Betweenness centrality reveals the intermediaries, or middlemen, from the data.
- Clustering: This algorithm groups nodes that share similar properties into sets called clusters. A cluster often represents parts of the graph topology that belong together.
- Degree Centrality: This algorithm measures a node based on how many direct connections—or degree—it has. Degree Centrality highlights who directly knows the most people.
Using the Example Application to Spot Potential Fraud
The example application we built with Perspectives includes two ways to explore potential fraud rings:
- The Alerts module visualizes potential fraud rings found through automated queries.
- The Explorer module allows you to examine accounts or transactions of your interest and interactively explore the data from that point.
The following visualization in the Alerts module shows potential fraud rings that have been discovered through Gremlin query alerts and supports exploration of related Neptune elements. Focusing on the fraud ring with 10 accounts that share several features, you can right-click to visualize a particular ring.
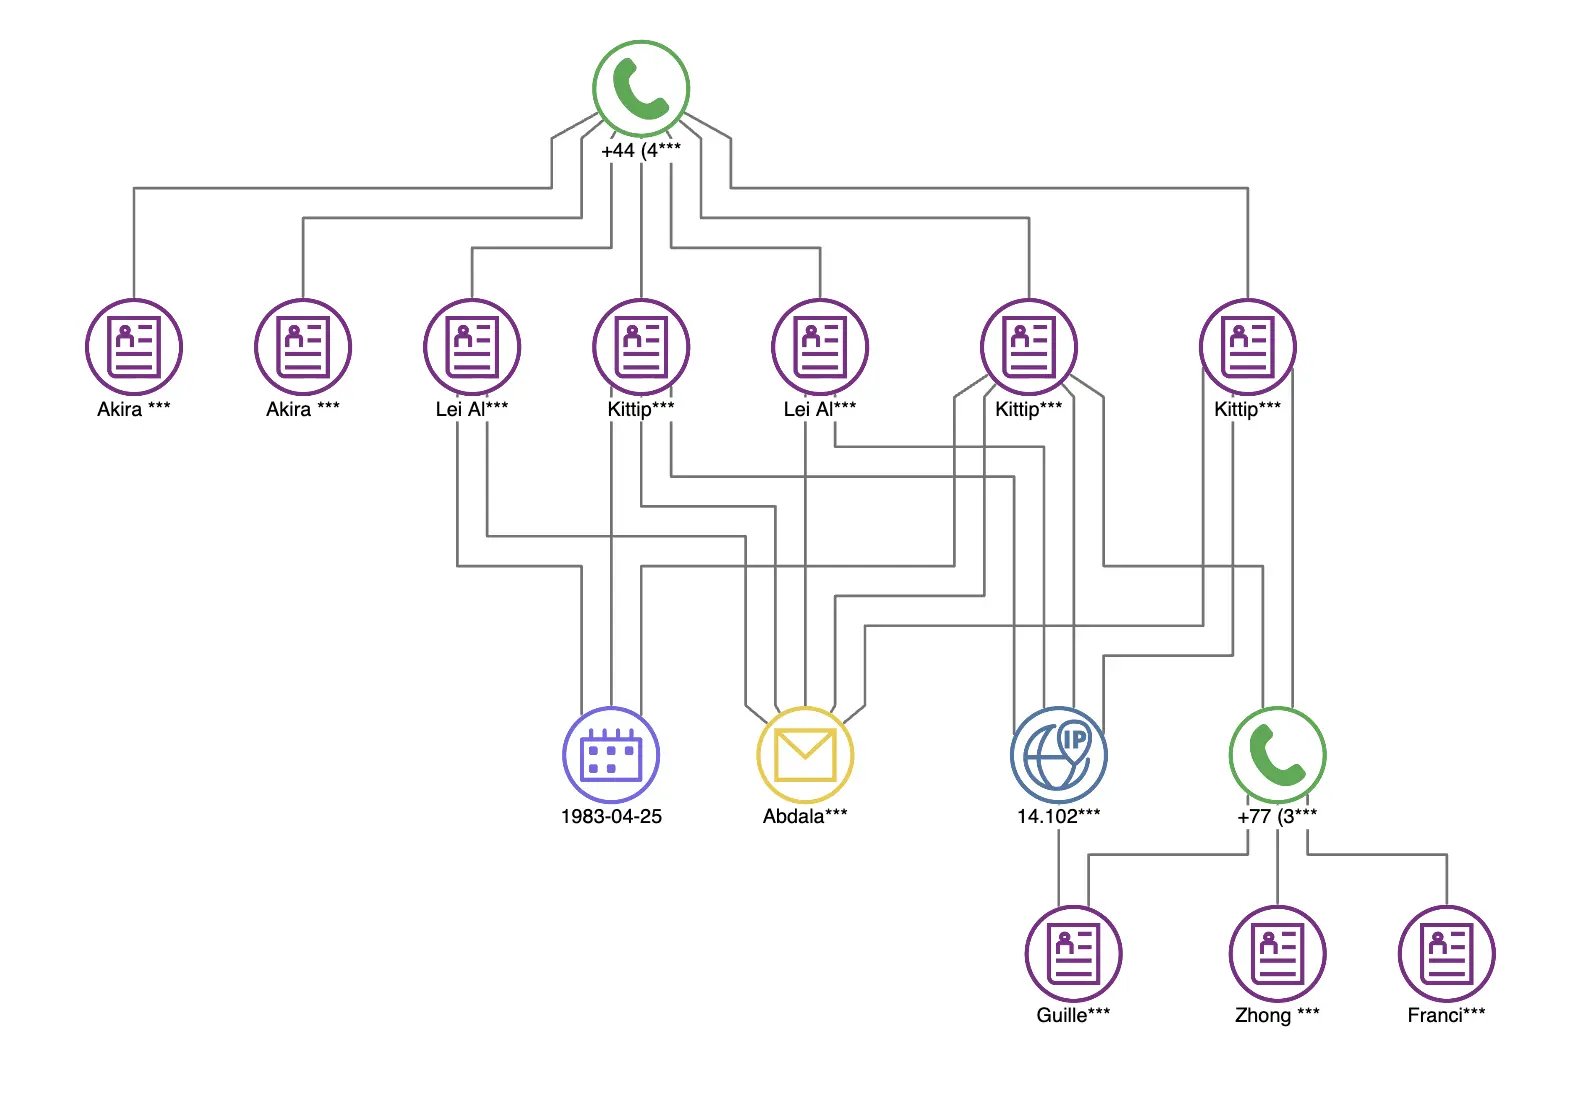
Getting a closer look at a graph of a potential fraud ring.
The Explorer module shown in the following figure allows you to input a Gremlin query to find the elements you want and then you are able to explore the results by loading additional related elements and applying interactive filtering to further adjust the results.
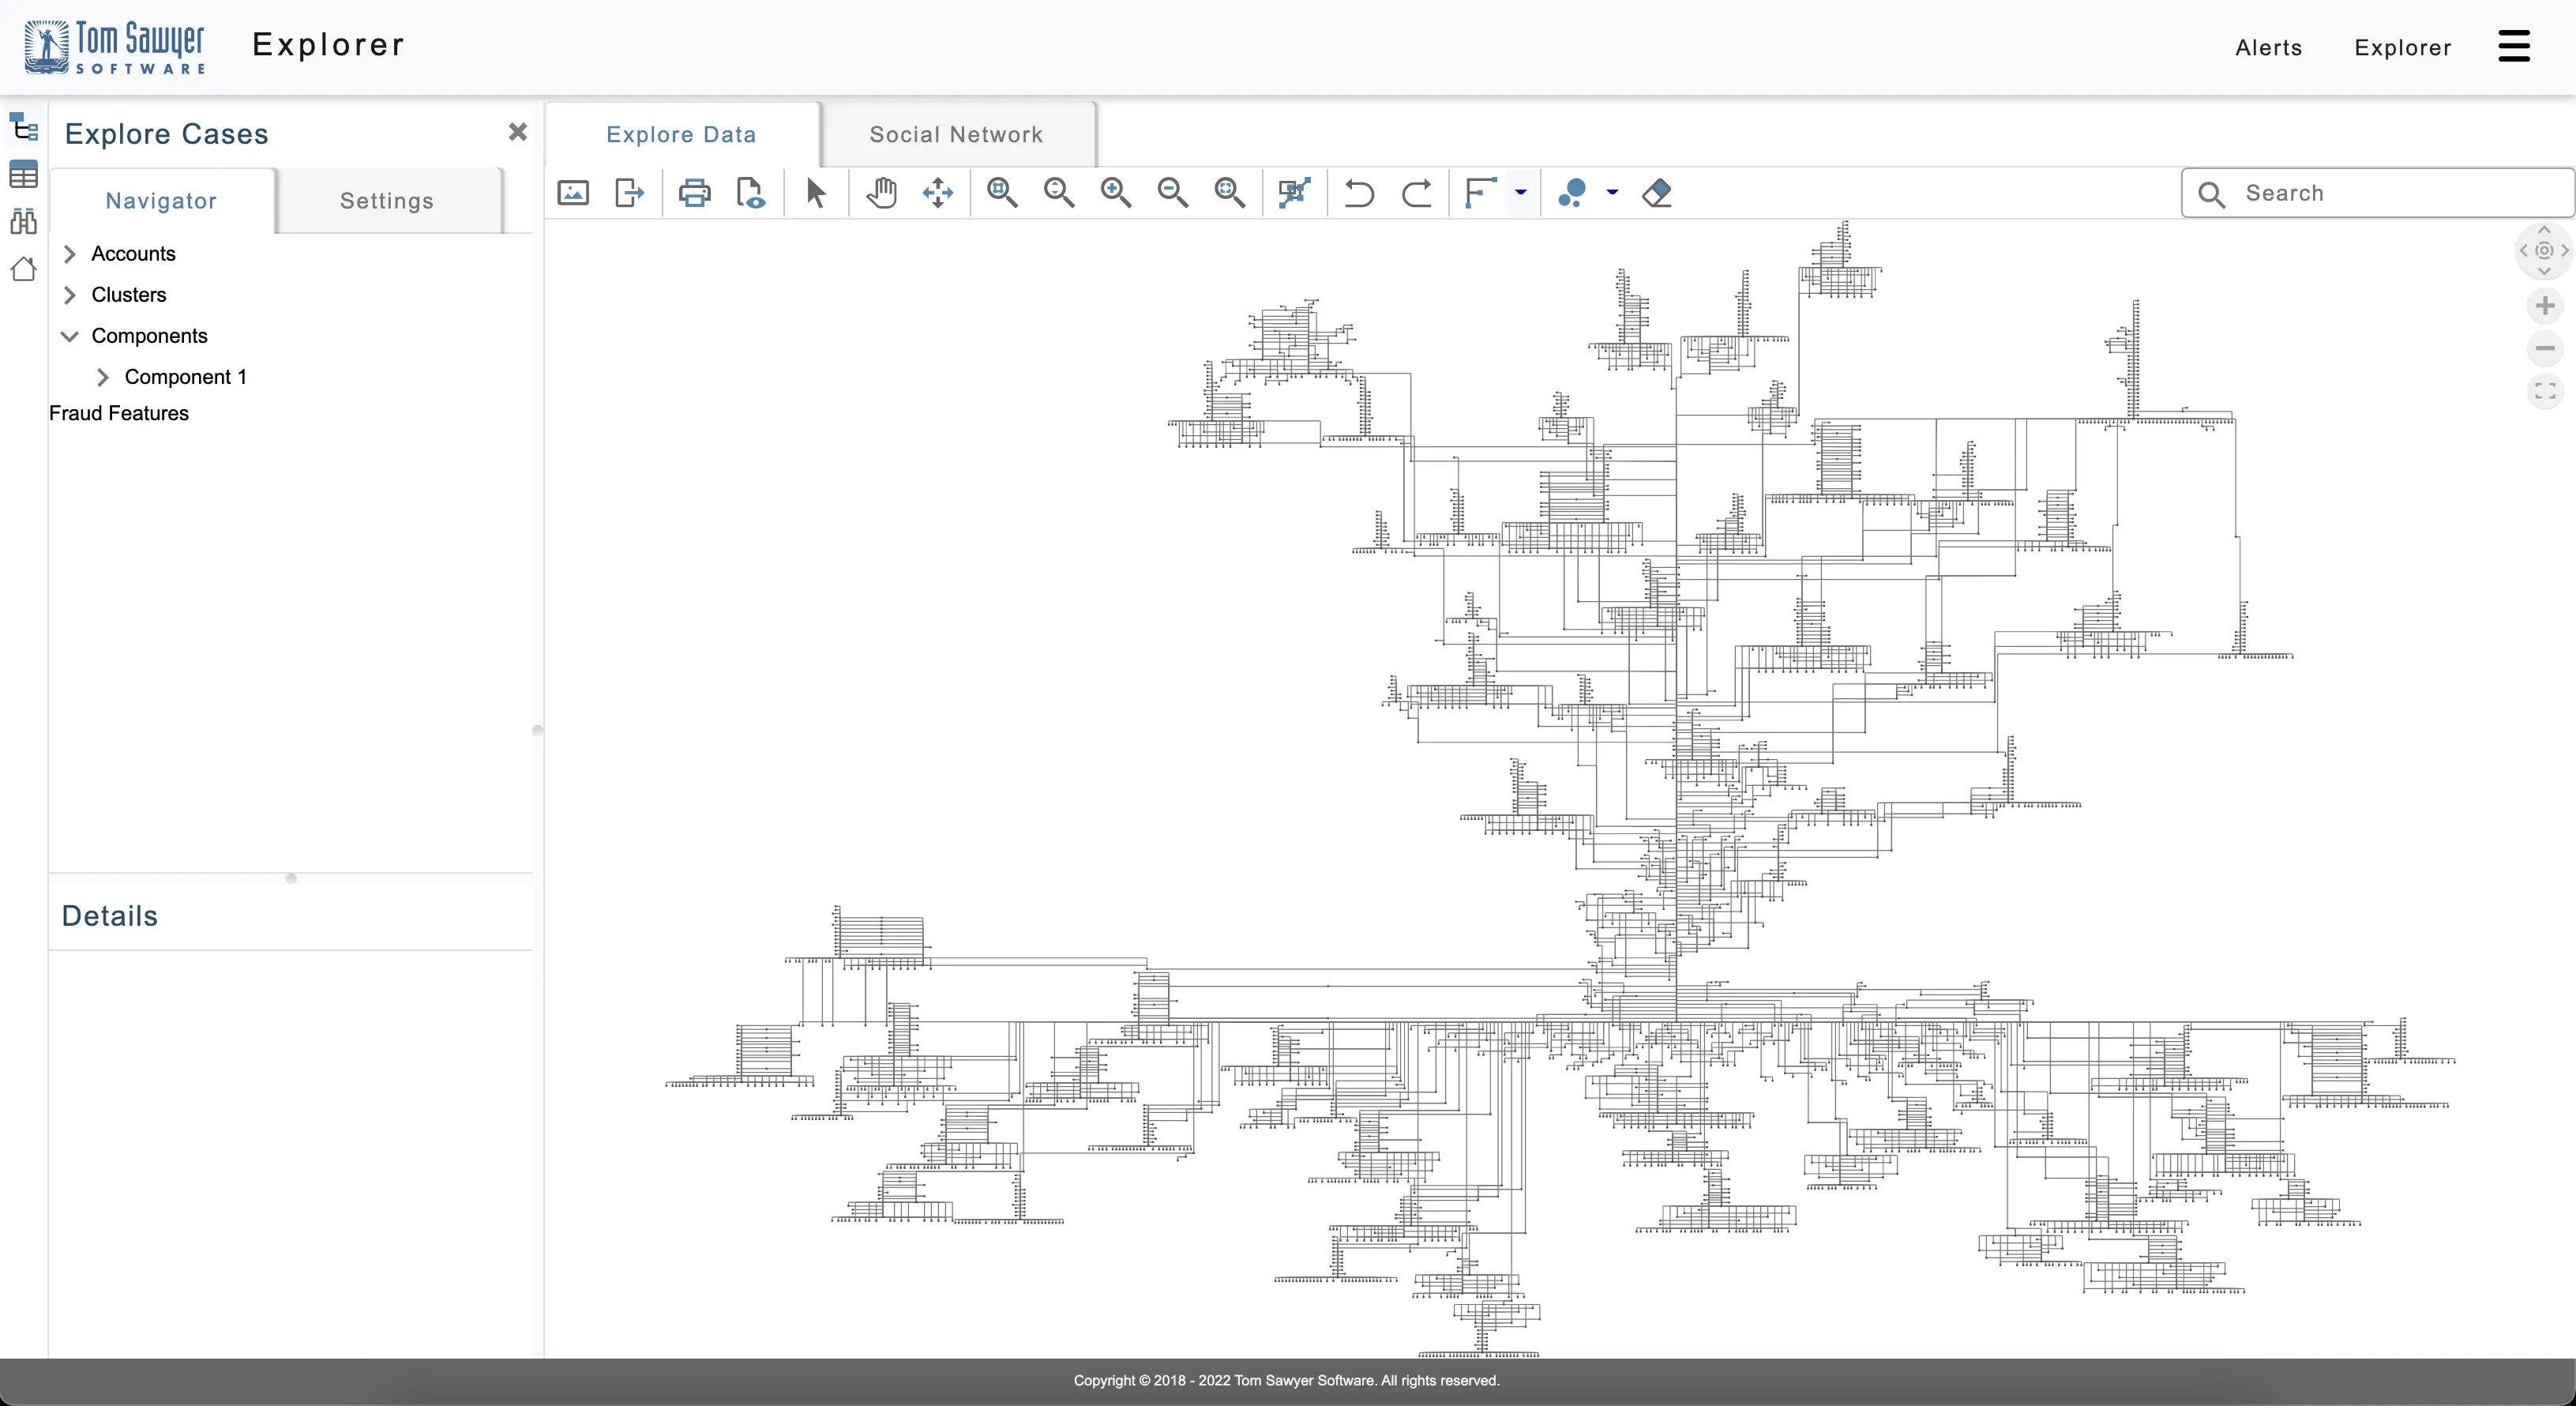
The Explorer module showing a large graph of related elements.
Watching for Bots
Some fraudulent attacks can also take place through bots, which can pose a serious security threat to financial institutions and their customers. One way to detect fraudulent bots in credit card fraud is by observing several transactions occurring from a single IP address within a very short time. For example, in the following figure you can discover that $6,000 in transactions take place from the same IP address in 30 seconds.
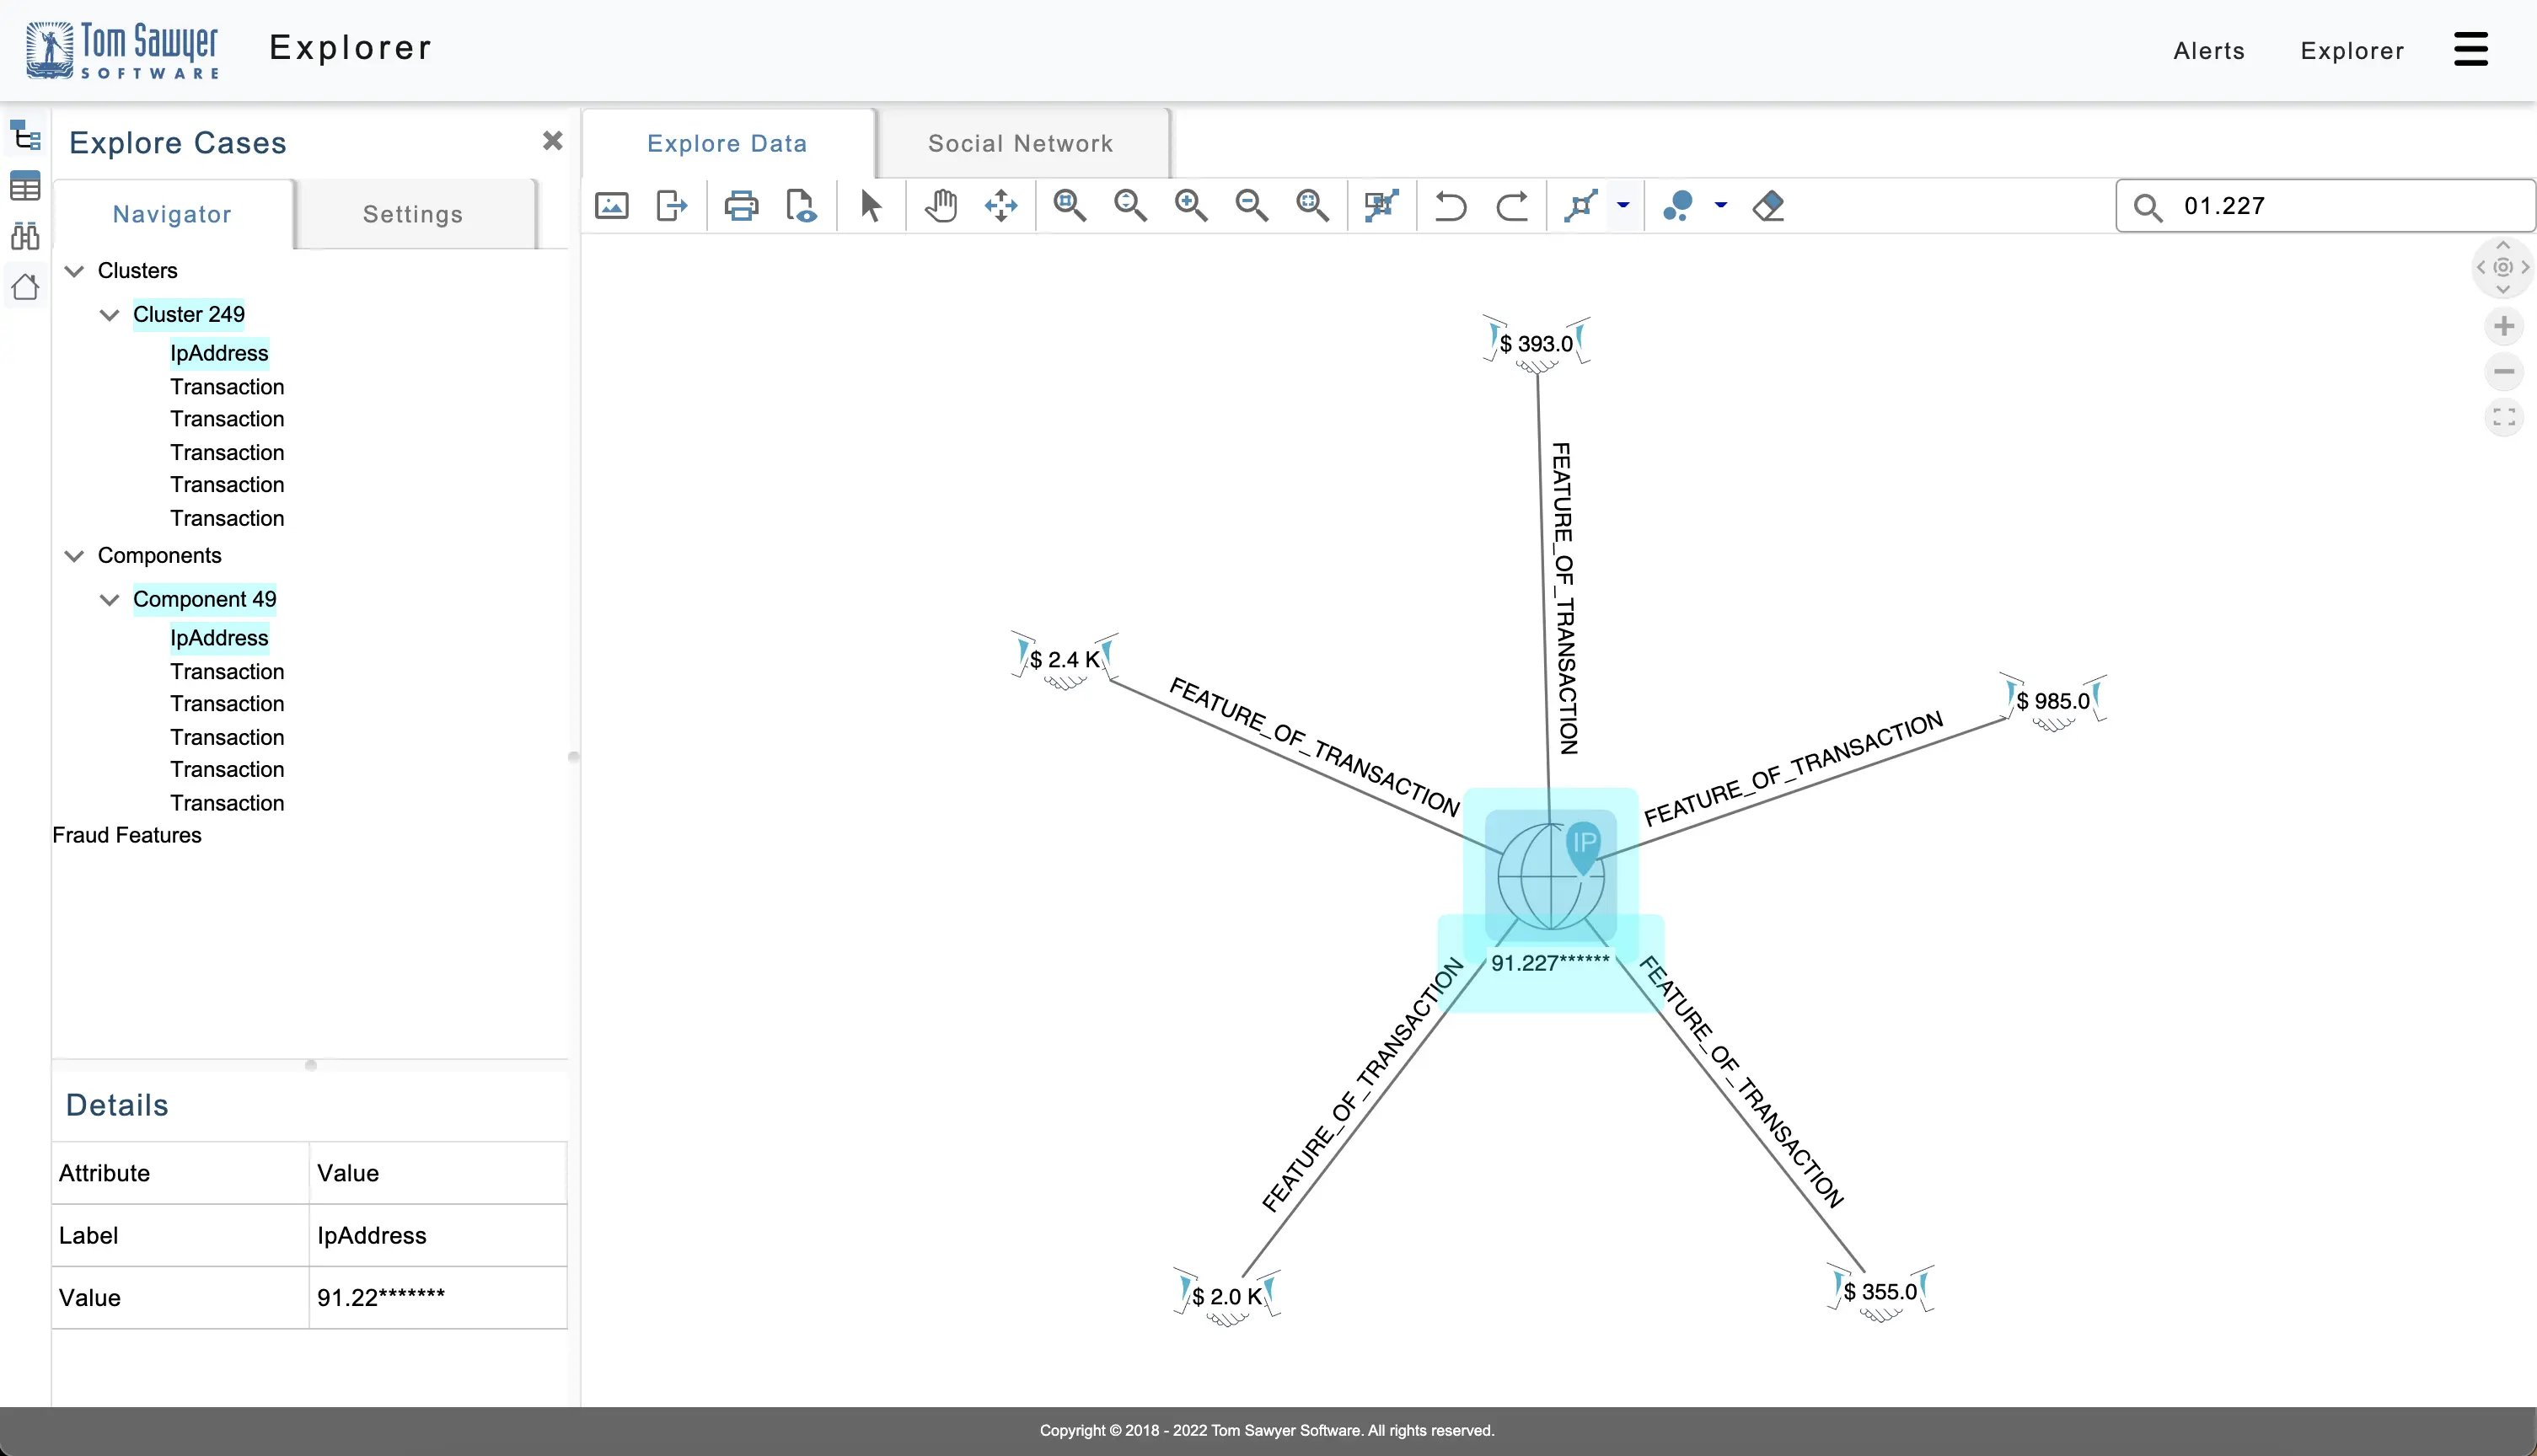
A graph of transactions suspected to be by a fraudulent bot.
This last figure shows that you can load related transaction and account information from the Neptune database to further investigate this activity and aid in detecting fraud.
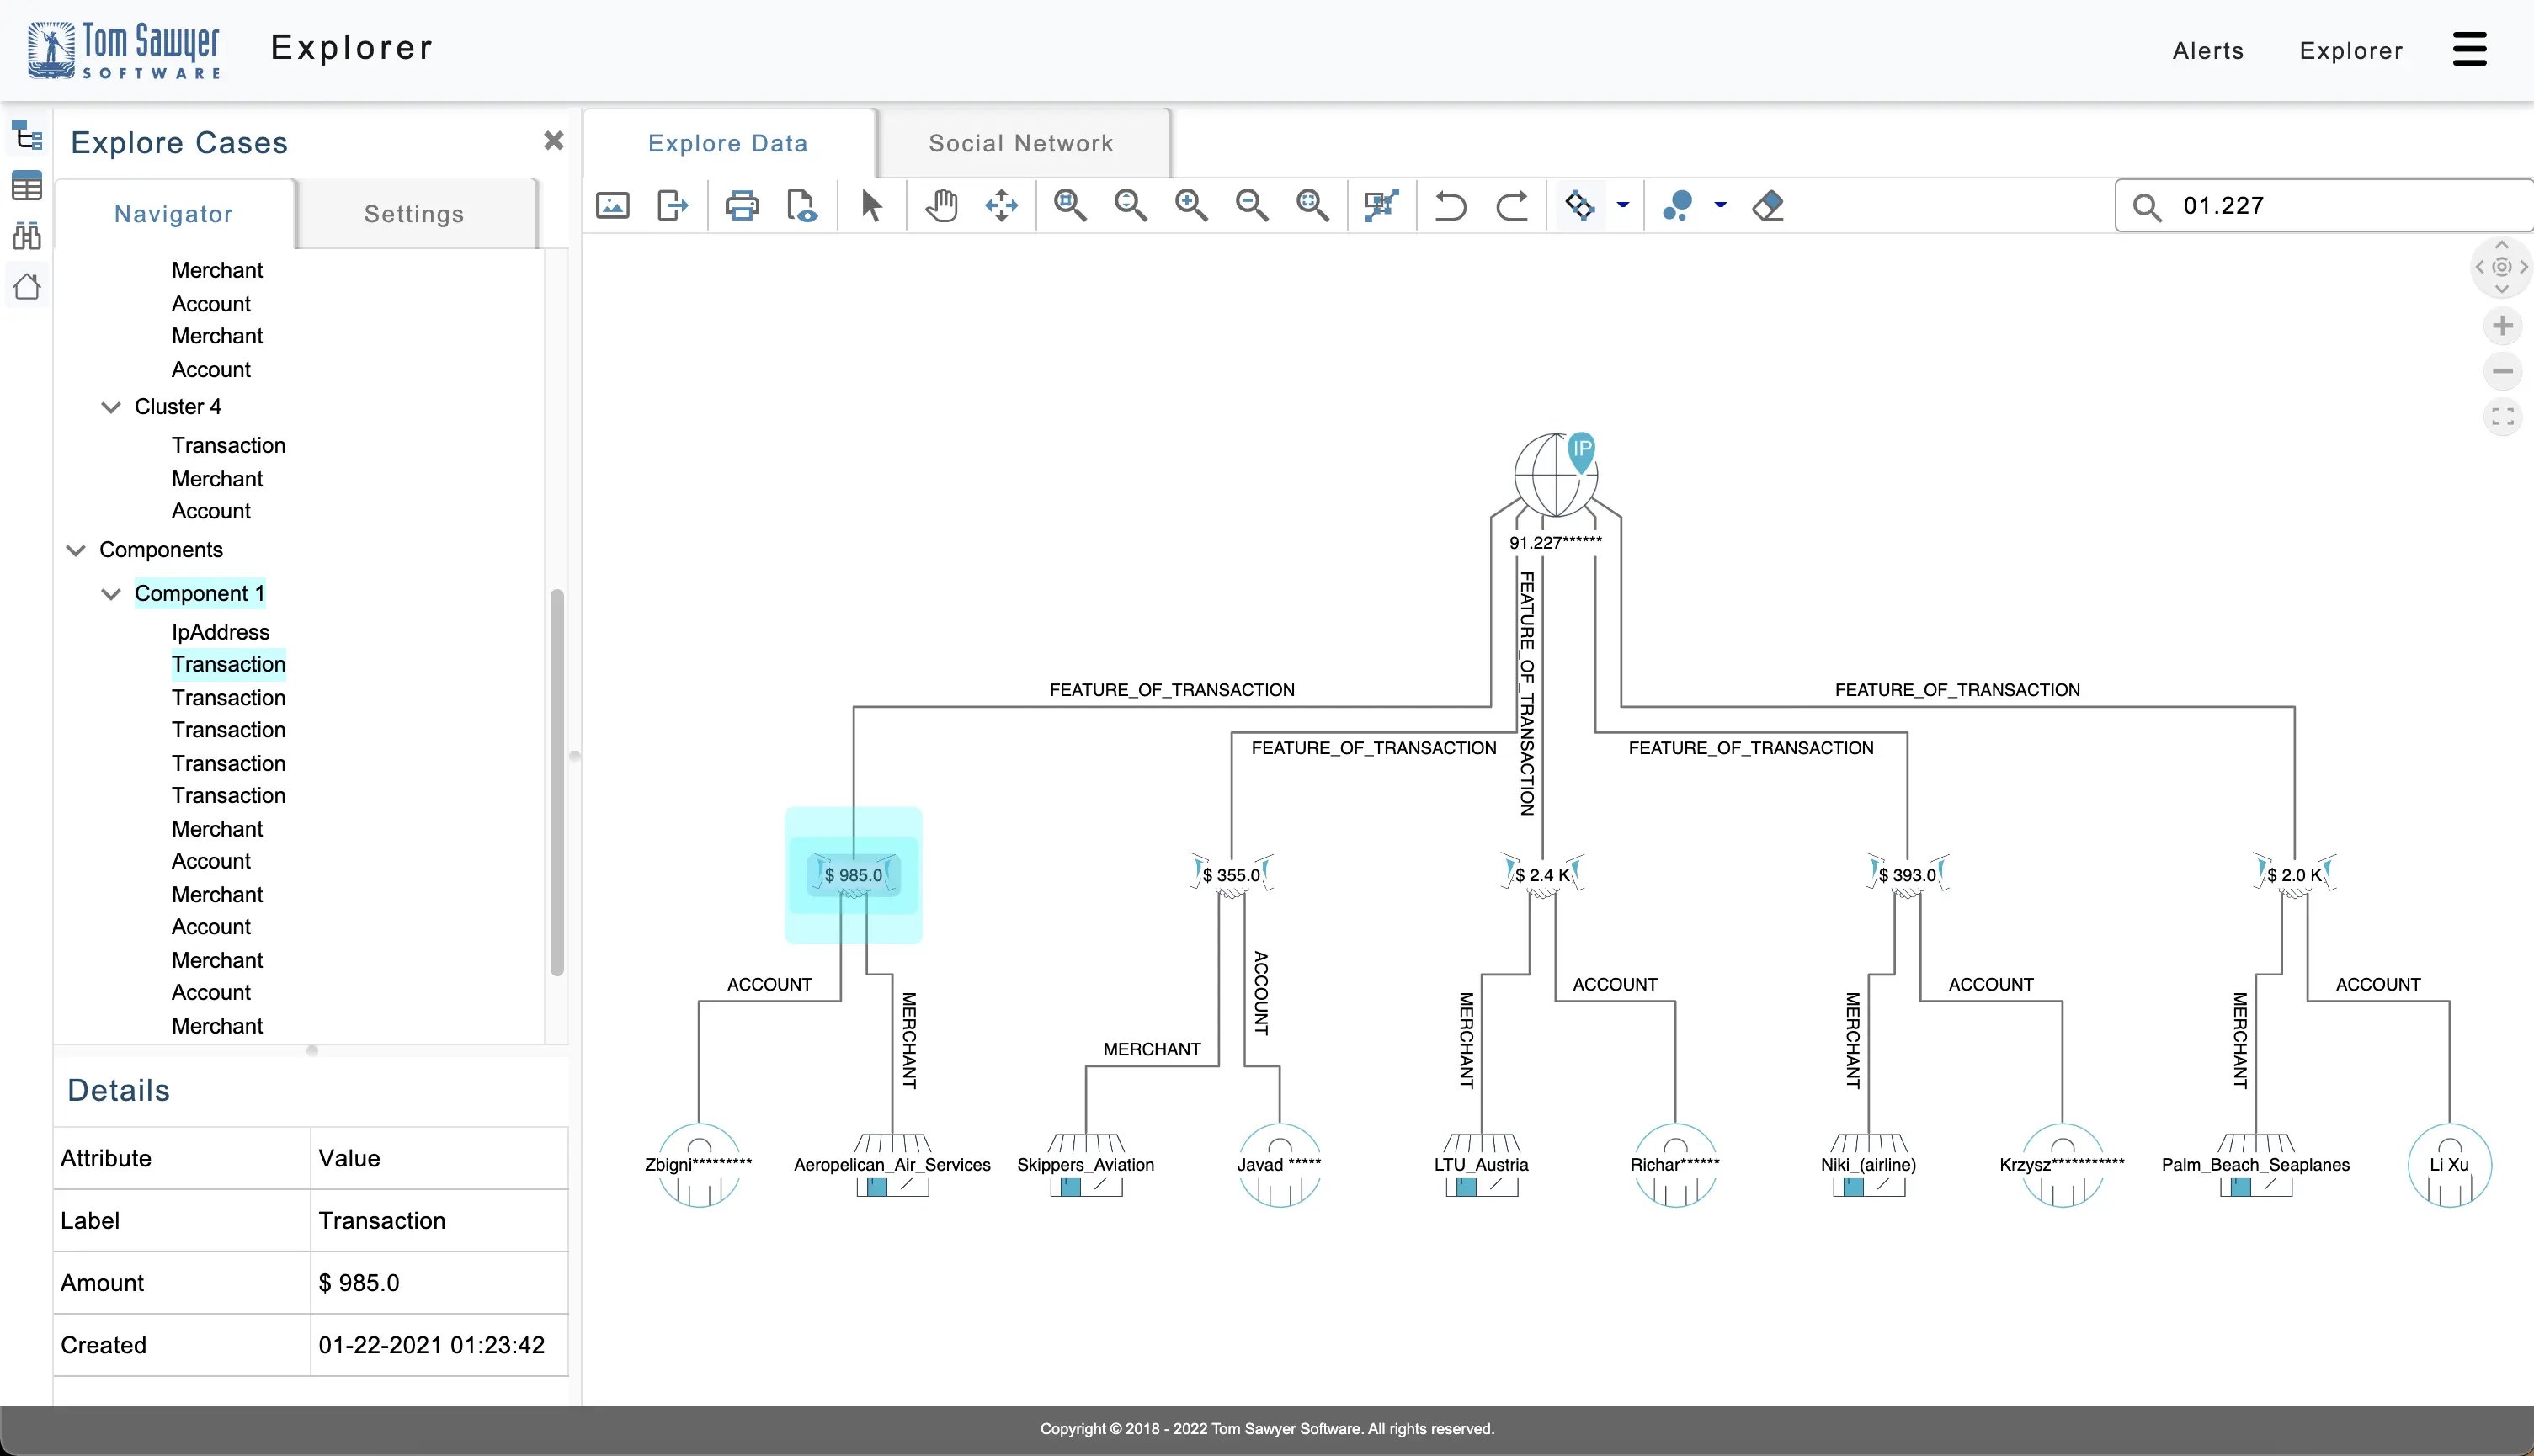
Using the example application to load additional transactions from the suspected fraudulent bot.
You can quickly see the accounts and merchants associated with these suspicious transactions. The sudden burst of transactions from this IP address may indicate fraudulent bot activity perpetrated by fraudsters.
Conclusion: Fight Financial Fraud with Perspectives
With Perspectives visualization, navigation, and analysis you can build and deploy a custom application that explores fraud rings, their related elements, and the patterns in the overall transaction system to find and disrupt systemic fraud. This ability to incorporate automated real-time detection with interactive investigation supports financial institutions in their response time to quickly discover financial fraud.
Ready to build your fraud prevention application with Tom Sawyer Perspectives? We can help you get off and running with a guided evaluation and free trial. You’ll receive our software with complete product documentation and free technical support. We also offer consulting and training during the evaluation to ensure a smooth and successful experience.
Reach out to us with any questions or feedback—we’re always happy to hear from you.
About the Author
Max Chagoya is Associate Product Manager at Tom Sawyer Software. He works closely with the Senior Product Manager performing competitive research and market analysis. He holds a PMP Certification and is highly experienced in leading teams, driving key organizational projects and tracking deliverables and milestones.
Submit a Comment