Traditional org charts answer only one question: Where do I fall in the company hierarchy? But an employee needs to know far more to be successful. What teams will I be a part of? Who can mentor me? What internal processes do I need to master?
Tom Sawyer Software recently partnered with Walt Brown, the “Christopher Columbus of the organizational graph,” to create OGraph. This browser-based application created with Tom Sawyer Perspectives combines graph visualization with Brown’s extensive Organizational Cognizance Model to help employees understand their jobs and clearly visualize their roles as contributors to the company.
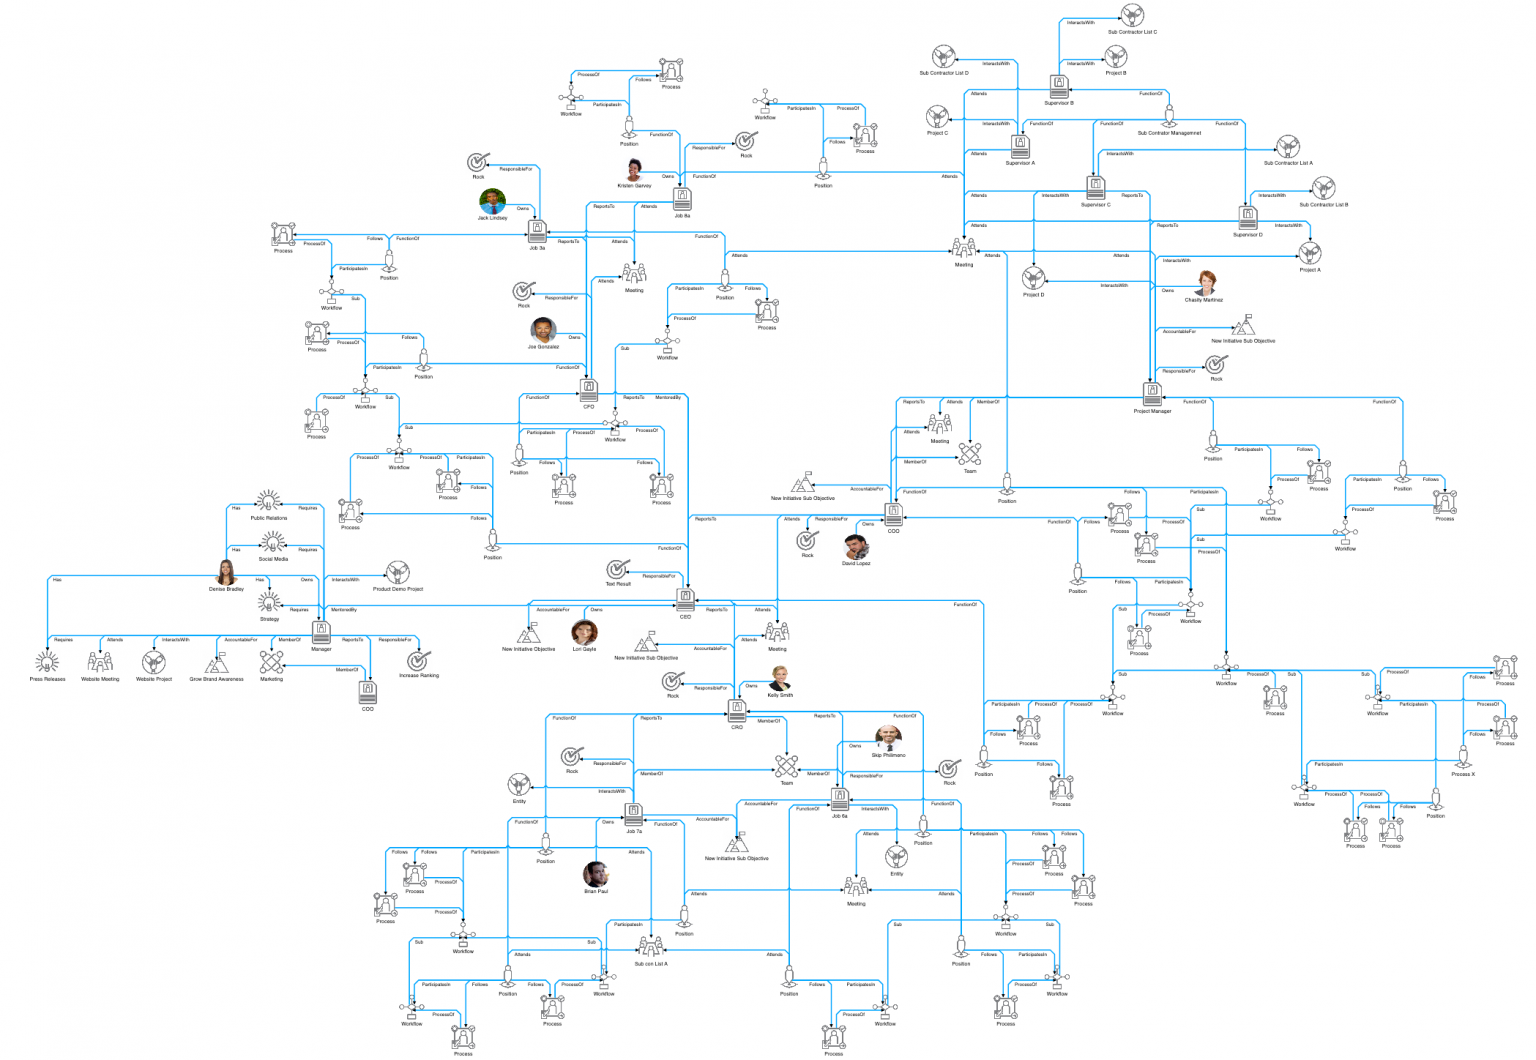
Combining Awareness, Knowledge, and Connectivity
In his new book, Death of the Org Chart: Rise of the Organizational Graph, Brown introduces a new way to look at an organization. It is based on the belief that a simple understanding of who falls where in the company pecking order isn’t enough for an individual—and thus a business—to succeed. After helping over 200 companies streamline and clarify their organizations, Brown discovered that all employees should be able to answer 14 basic questions about their job. Questions such as What is the purpose of my job?, What skills do I need to advance?, and What systems do I interface with and need to master? Click here for the full list.
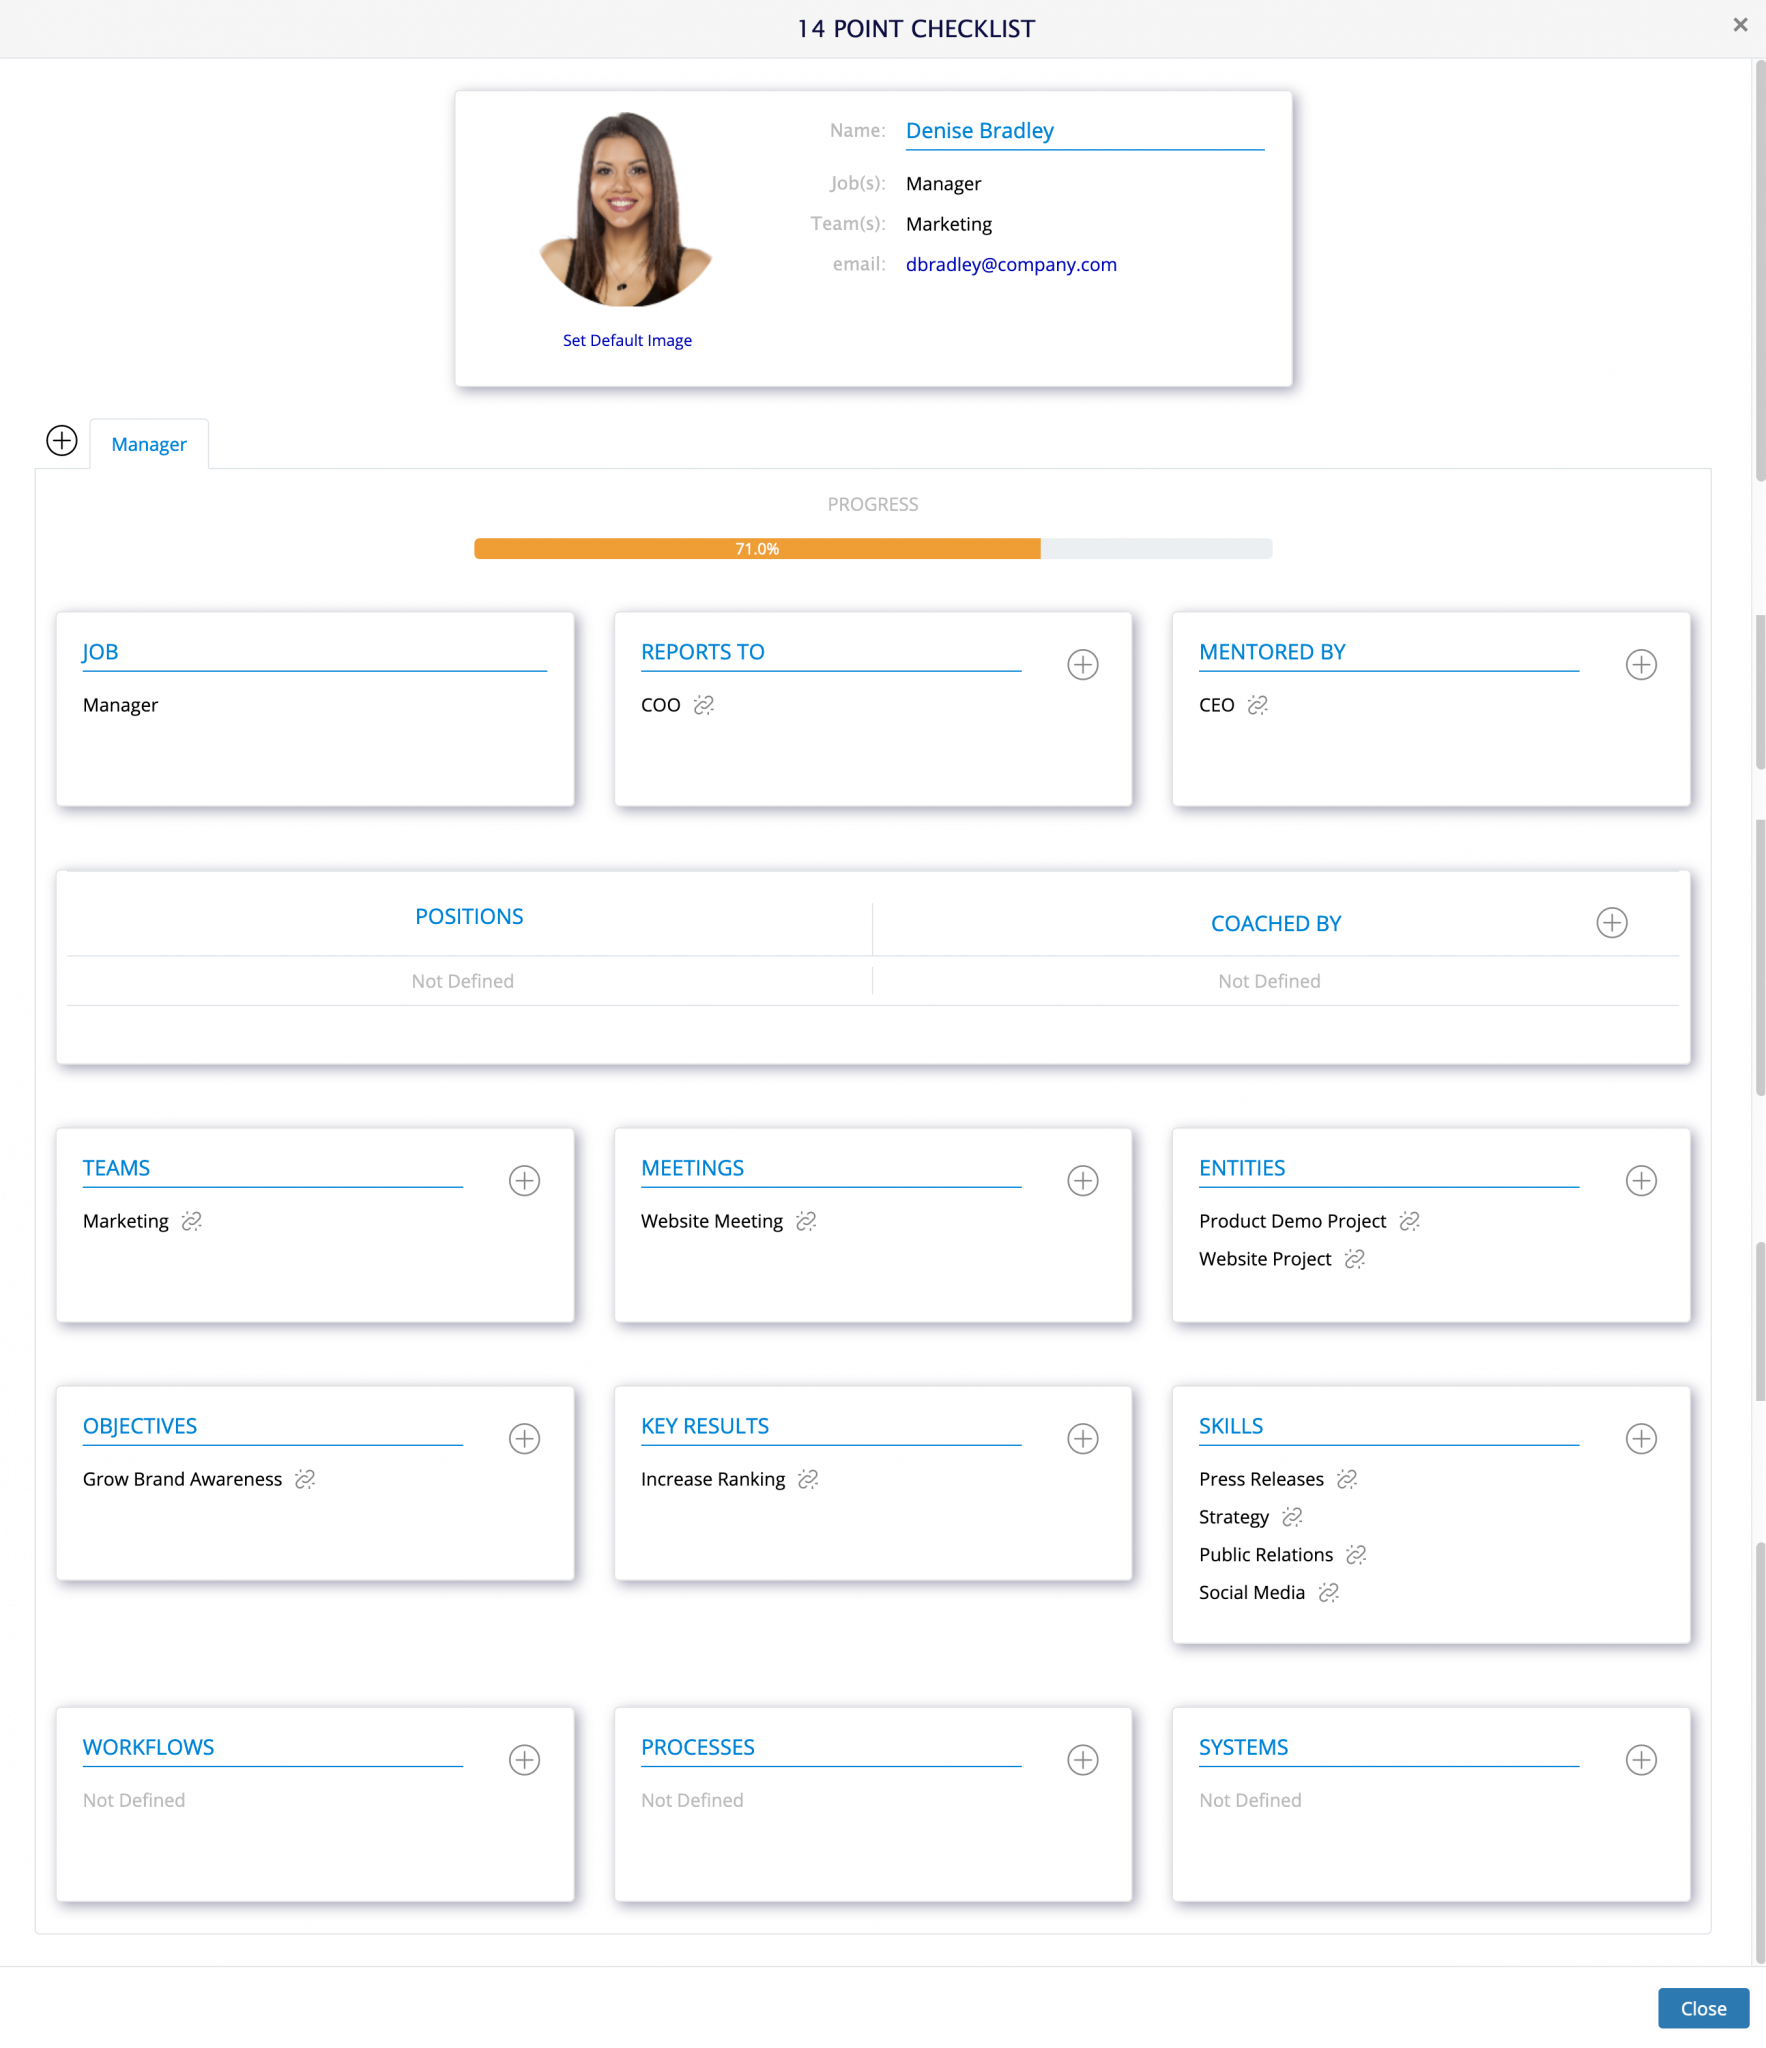
Armed with the answers to the questions, an employee completes the 14 Point Checklist in OGraph. Once that’s done, the OGraph application visualizes the answers and draws connections between them in a graph visualization.
Visualizing the Organizational Graph
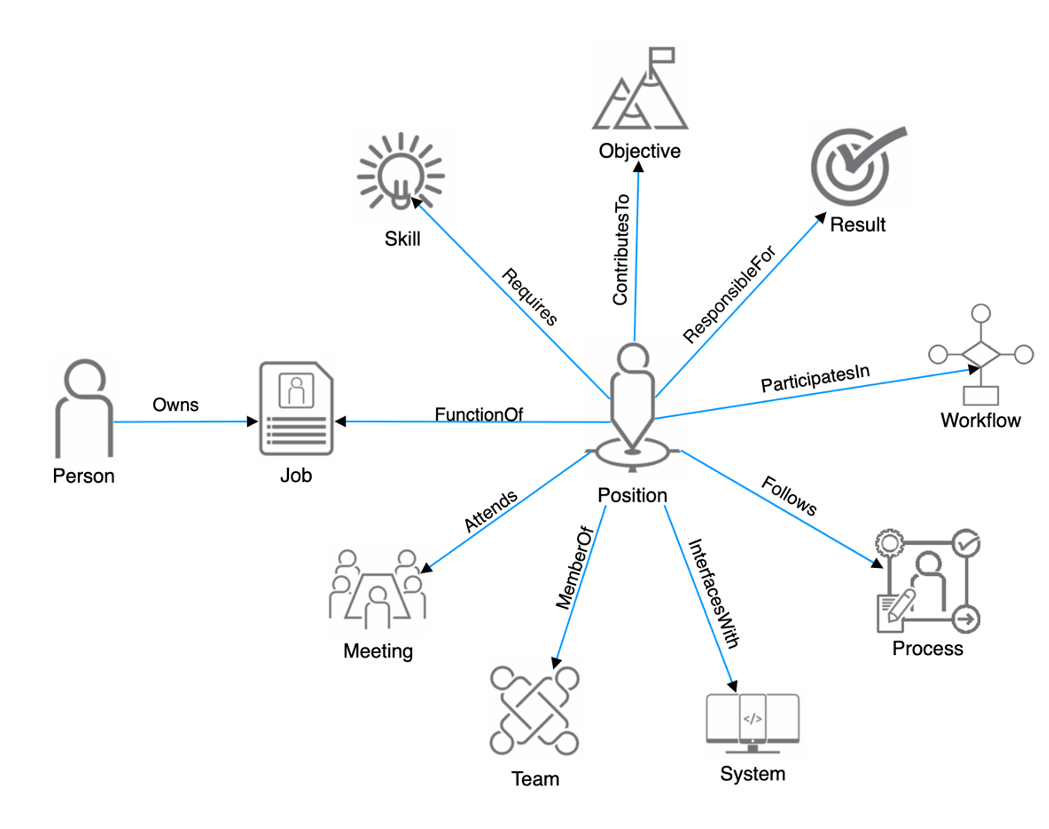
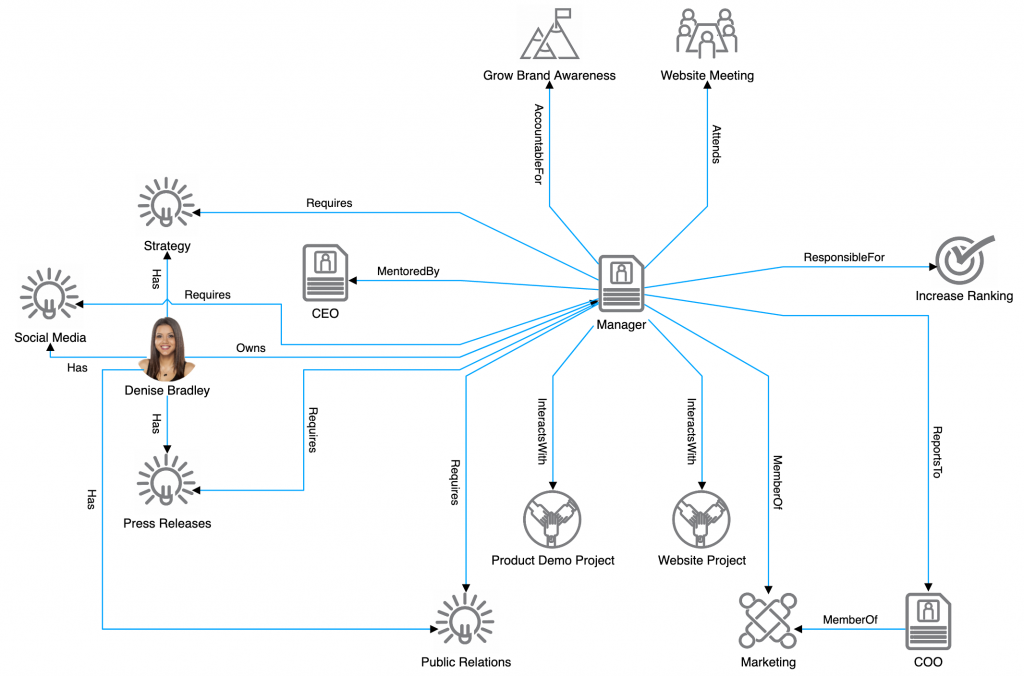
To visualize an organizational graph in a meaningful way, each node represents an entity (a person, position, meeting, skill, etc.) and each edge represents the specific way in which the nodes are related. For example, a Position node connects to a Meeting node with an Attends edge. Likewise, a Position node connects to a Team with a MemberOf edge.
Think about the impact this graph would have on brand-new employees on their first day. At a glance, they would understand who their mentor is, what teams they are a member of, the objectives they are accountable for, all of the meetings they need to attend, and more!
And best of all, the knowledge shared in OGraph will have a positive impact on the entire company. Organizational cognizance will increase for whole departments as they begin to see the connections they have to one another.
Filtering Your Organizational Graph for Effectiveness
A graph visualization of a large corporation can be huge. By simply filtering the result down to an individual, that person becomes the center of the story. Now, they can see how they connect to groups and how their skills connect them to projects.
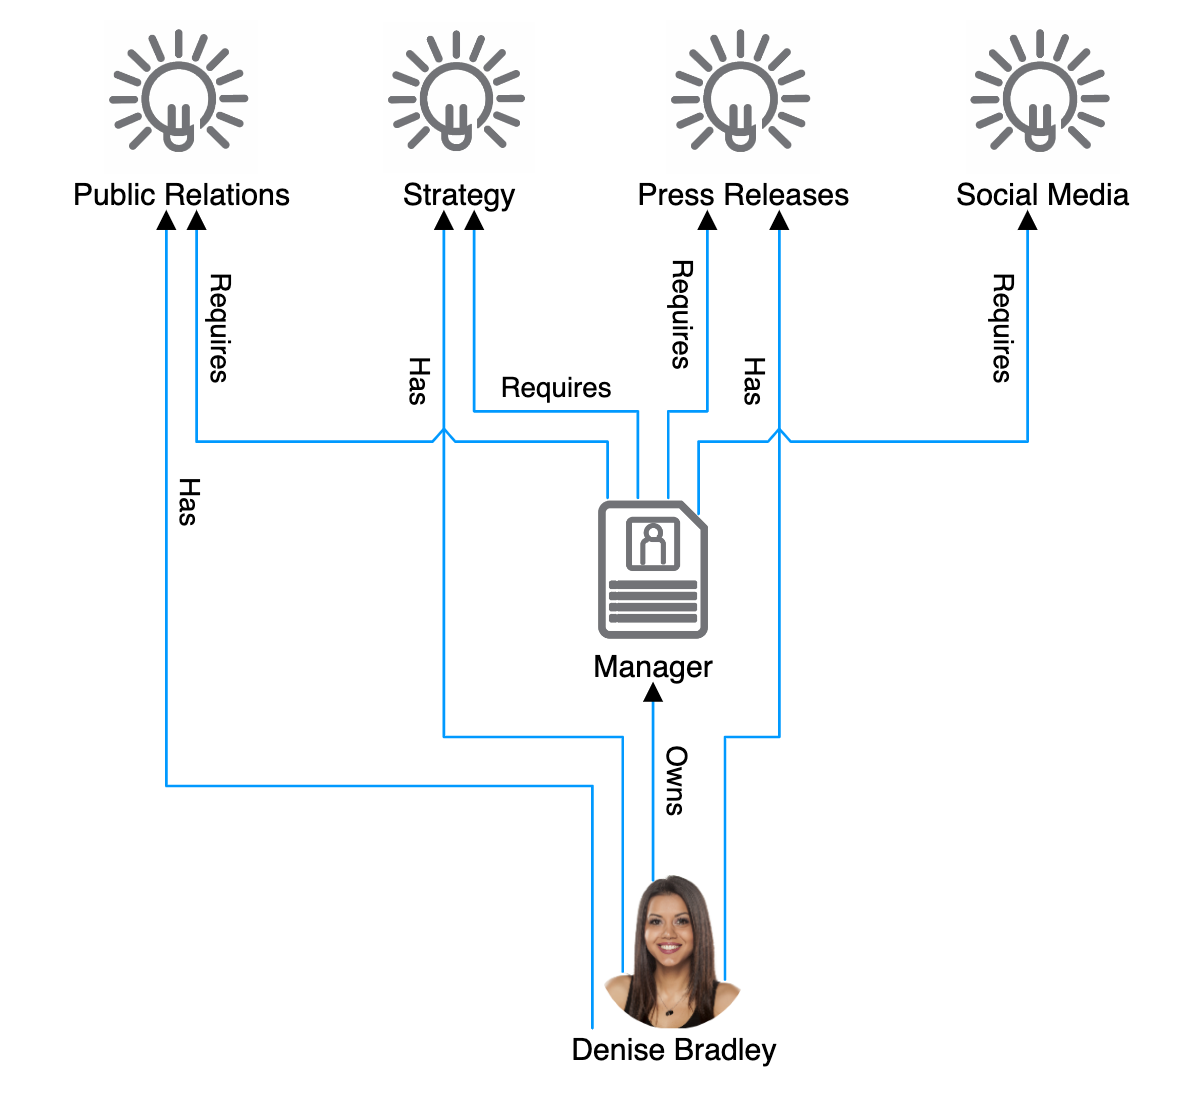
Filtering also allows managers to set up projects in a unique and effective way. Instead of beginning with people, managers can filter the graph for skills and objectives. Doing so will then lead to the people in the company who have the abilities needed to accomplish the set goal.
Turning the Organizational Graph into a Knowledge Graph
Sometimes, it’s important to understand the dynamic of your relationship with a coworker. Are you peers? Or, does the person emailing you out-rank you by 14 rungs? The nature of a graph visualization and Tom Sawyer Perspectives lets users 10x their experience by allowing them to truly interact with the data and gain insight. Employees wondering how they fit in can view only one “hop” away from themselves to see their direct responsibilities and connections. Expanding the view to two hops out shows the people and teams impacted by a particular project.
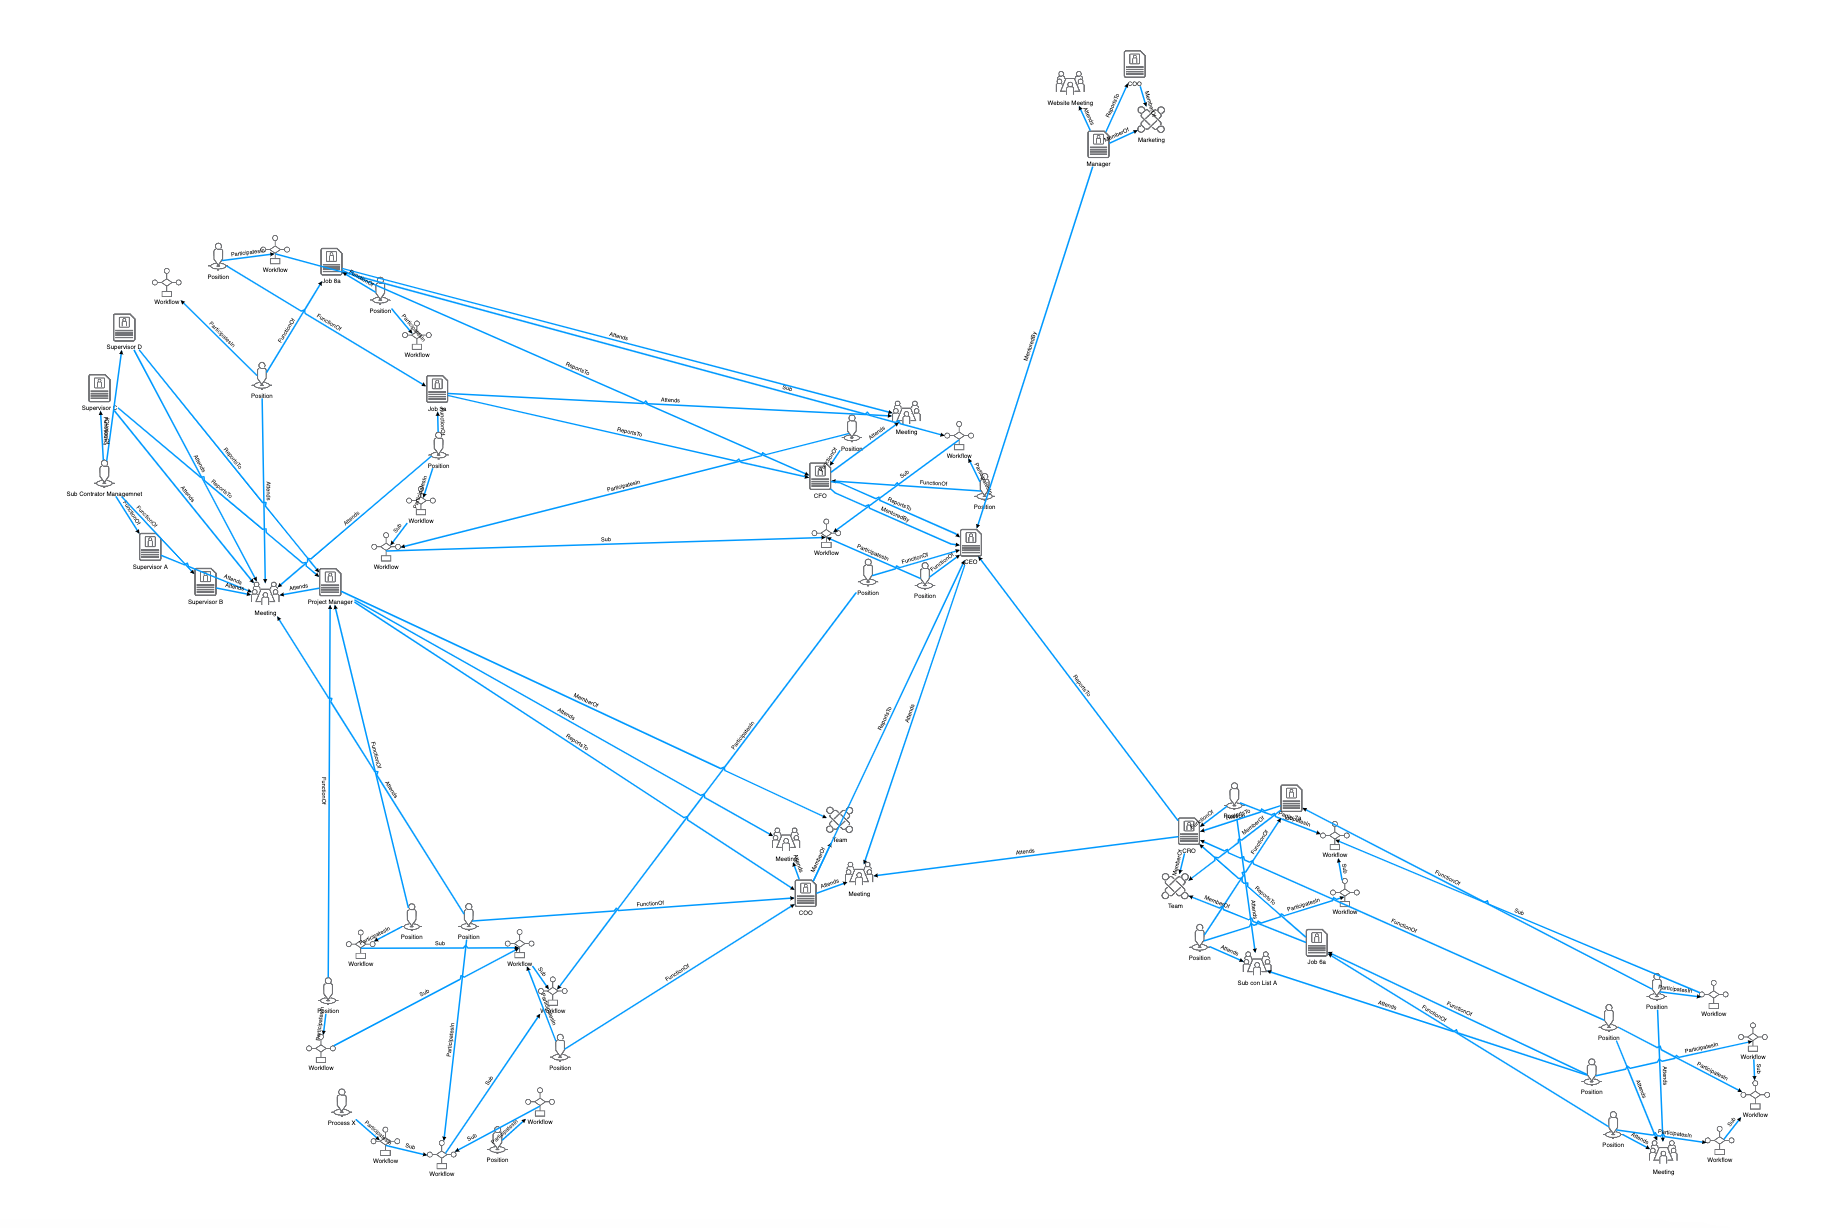
Exploring various layouts can also add new knowledge about your organization. Hierarchical layout shows the inherent hierarchies within an organization; it’s the classic org chart we’re used to. But with Circular layout, you can see clusters of folks and the web of their relationships. To find the person at the center of groups, use Symmetric layout.
Finally, the organizational cognizance provided by the graph visualization is just the beginning. Selecting a node displays basic information in the Inspector view. Additionally, you can add attachments, videos, file links, and more to each individual node. Store your standard operating procedures, processes, and workflows by including a Rich Text note, hyperlink, or the actual file.
Creating a SaaS Solution with Tom Sawyer Software
After honing his ideas in the two books The Patient Organization and Death to the Org Chart, Walt Brown reached out to the Solutions Team at Tom Sawyer Software to translate his vision of OGraph into a full-fledged SaaS application.
“I was literally drawing graphs like these on whiteboards while not really knowing what they were. When I found Tom Sawyer Software, I thought: Here’s the solution to my problem!” -Walt Brown
In addition to building the OGraph application and its data-driven views with Tom Sawyer Perspectives, our engineers defined a secure multi-tenant architecture, used Spring Boot to create a containerized auto-scaling server environment, and integrated a payment and subscription platform. Deploying on AWS ensures a secure and seamless enterprise application deployment.
If you are dreaming of a data-driven application but need training, methodology consulting, targeted development support, or even a full stack team, Tom Sawyer Software can deliver it. We build bridges between new and existing services to automate a great end-to-end customer experience.
Try It for Yourself
Start your 14-day no risk trial of OGraph today.
About the Author
Kristin Petersen is the Marketing Content Manager at Tom Sawyer Software. She has 17+ years of technical writing and editing experience in both the public and private sector, and transitioned into Marketing where she brings her strong technical background, writing experience, and creativity. She earned her Master of Science in Technical Communication from Drexel.

Submit a Comment