The huge amount of data being produced makes it difficult to separate what’s important from noise. Once you’ve created a graph visualization of your big data, how do you know what to look...
Continue Reading
The huge amount of data being produced makes it difficult to separate what’s important from noise. Once you’ve created a graph visualization of your big data, how do you know what to look...
Continue Reading
Swimlanes organize graph visualizations in a simple, user-friendly manner. Typically, process flows use swimlane diagrams to group components into individual categories, or lanes. Each node...
Continue Reading
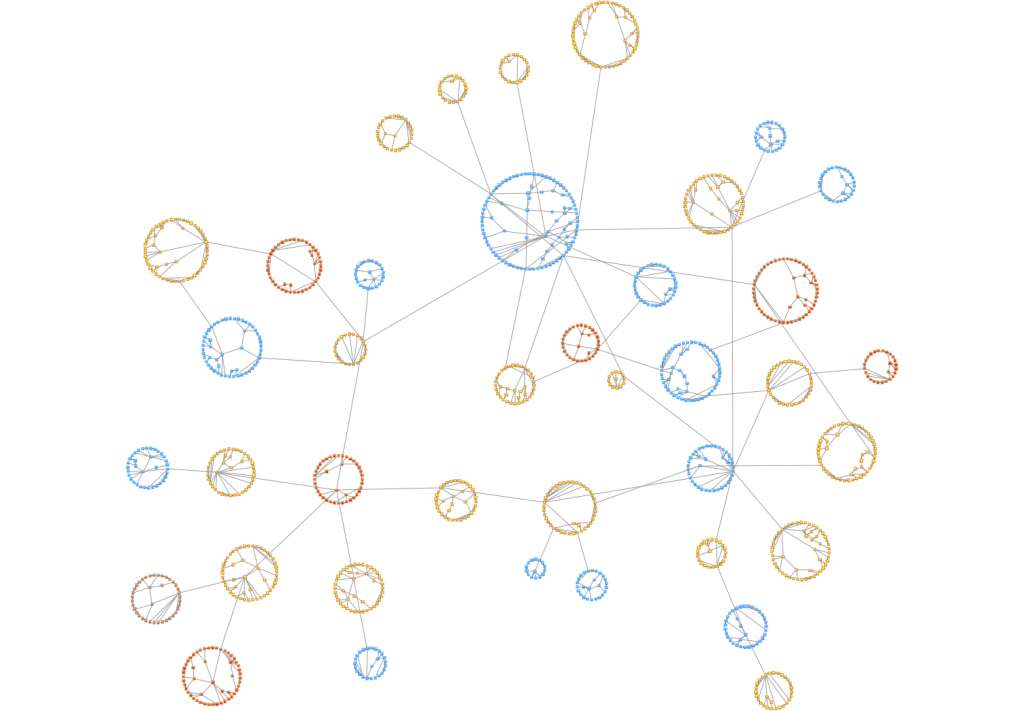
It’s a tale as old as time: you organize a massive database of facts and figures only to discover that the opening visualization is…a giant hairball! Sure, you can zoom in to 800% and...
Continue Reading
As the amount of data available to law enforcement agencies increases, so does the pressure for them to use that data in efficient and predictive ways to thwart crime. Centrality analysis...
Continue Reading
In the past month, the internet has exploded with information about coronavirus and the disease it causes, COVID-19. The vast amount of data feels like too much to keep up with. But that’s...
Continue Reading
You gather your data, choose the best layout, and find an analysis method that gets your users the insight they need. But before you can declare victory, you need to assign meaning to the...
Continue Reading
We can’t quit you, baseball! The season might be over, but we want more. So, we’re dipping into the baseball data to see what else we can learn. Read on for one more run around the bases! ...
Continue Reading
2019 marks the 115th year for World Series baseball in the United States. In a year when home run records were smashed with authority, we thought we’d take a look at America’s pastime...
Continue Reading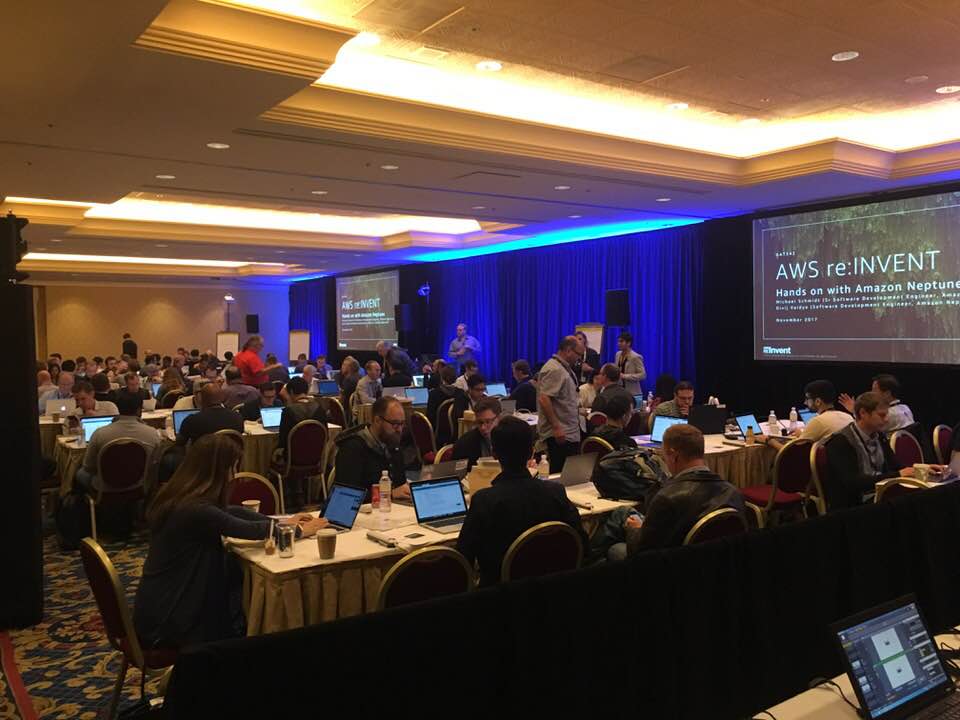
At AWS re:Invent, we revealed our partnership with Amazon Web Services (AWS) that supports the integration of Tom Sawyer Graph Database Browser and Tom Sawyer Perspectives with Amazon...
Continue Reading
Submit a Comment