
Kristin Petersen
Content Manager
Swimlane diagrams give context to processes. If you haven’t used them, swimlane diagrams combine the logic of a flow chart with the accountability of an action item list. They show who or what is responsible for each step in a process. Because people and processes are continually changing, automating swimlane diagrams saves you hours of repetitive labor in rearranging and updating content.
Automation is easier said than done.
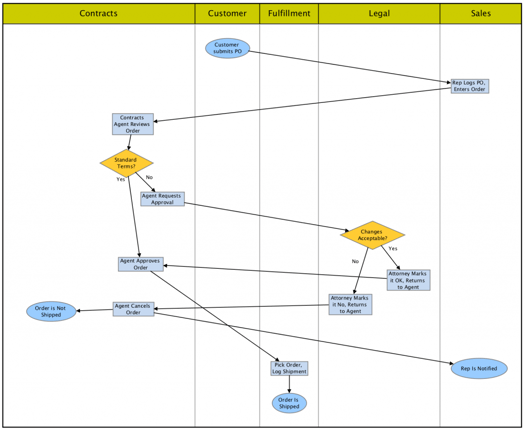
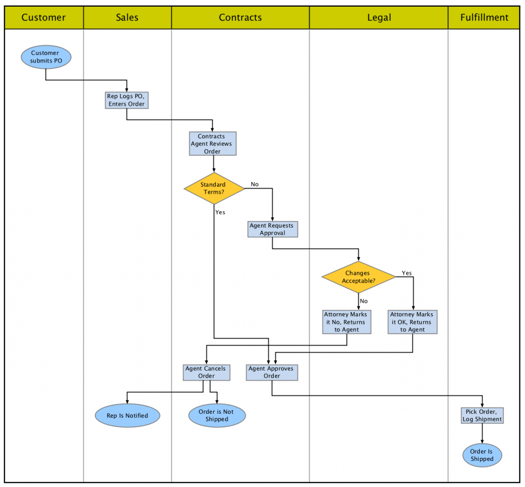
Below is an example of a manually drawn swimlane diagram for order fulfillment. Can you tell at a glance who does what, and in what order?
Let’s look at how swimlane diagrams are used in the real world, and some of the technical challenges in automating layout and updates. Our global expert, Krists Boitmanis, will give us an inside view of what makes automated layout work.
Swimlanes Help Texas Consumers Switch Energy Suppliers
Swimlane diagrams serve critical functions in the real world, such as helping power the state of Texas.
For the United States, Texas has a somewhat unique electricity system. Customers choose their electricity supplier from a number of competitive companies, instead of just settling for a local power utility.
The Electricity Reliability Council of Texas (ERCOT) runs the state’s electricity system. ERCOT uses swimlane diagrams to describe how competitive energy providers in the state must handle common customer services tasks such as starting and stopping electricity service, handling power outages, and switching providers.
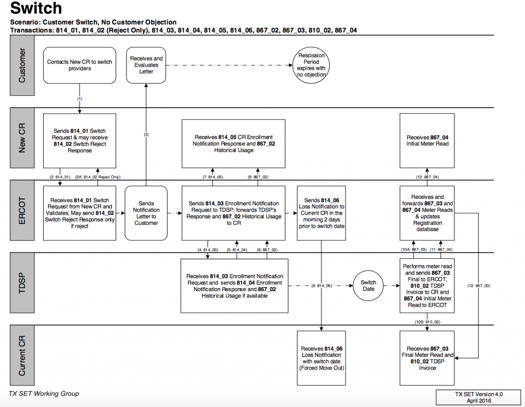
ERCOT’s diagrams help make sure customers receive safe and reliable service for a necessary but dangerous commodity. They also create a level field on which retail energy companies compete.
Technical Challenges in Automating Swimlane Diagrams
By itself, manually creating the first version of a swimlane diagram can be challenging. Each lane contains the tasks assigned to a person, department, software program, machine, or other entity. Presenting the order of lanes and tasks with the various actors requires logic and art. Maintaining and changing swimlane diagrams is equally challenging and time consuming.
To understand more about the logic and art of swimlanes, I spoke with Krists Boitmanis, Principal Technical Design Architect, in our Riga, Latvia offices.
“To automate the layout of swimlane diagrams, you want intelligence that minimizes the number of crossings and the lengths of routes between items in the flow,” Krists said. “You also want to minimize how often the flow moves from one entity’s lane to another.”
Without this type of intelligence, you get a tangled bird’s nest of a diagram.
“Automated layout for swimlane diagrams should choose the optimal order of lanes,” Krists explained, “to reduce the number of crossings and the length of connections.”
Automation needs to handle changes to the underlying data, because processes change. If you’re practicing continuous improvement, you may remove or reorder steps in a process for greater efficiency. You might also add a step to reduce defects or improve safety.
Your diagramming application shouldn’t require hours, days, or even weeks of effort to keep up with this type of improvement. If it does, you’re losing productivity, efficiency, and competitive advantage.
Automating Swimlane Diagrams Simplifies Presentations
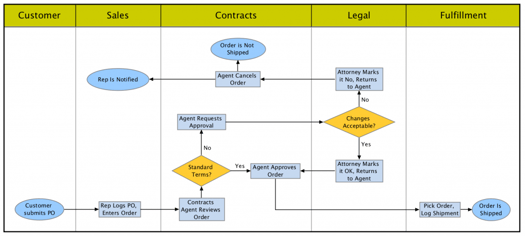
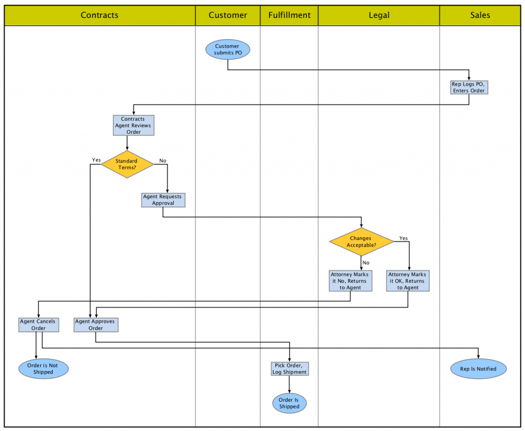
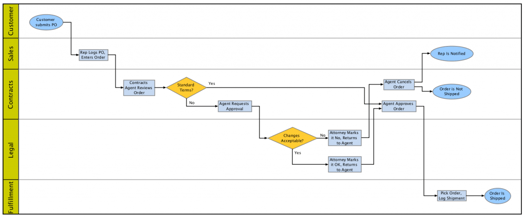
Automation of layout must also adjust to changing the graphical style of swimlane diagrams. You may need to change the orientation of a swimlane diagram from vertical to horizontal to fit on a presentation slide. Changing in the other direction, from horizontal to vertical, supports printing on standard paper.
These types of changes shouldn’t require hours to accomplish, but often do.
Not everyone is adept at reading the standard flow chart symbols that are often used with swimlane diagrams. Changing the format to use icons, photos, or other representations can make diagrams easier for non-technical audiences to understand. Again, automation should make this type of change nearly instantaneous.
Automation Keeps Swimlane Diagrams Accurate
Automating swimlane diagrams obviously saves time. Automation also reduces the possibility of errors by ensuring consistency.
People are bound to make mistakes while doing hours of manual work to rearrange swimlane diagrams. Words get misspelled, steps forgotten, connections put out of order. We’re only human. Because people make mistakes, we need more people to check revised diagrams for accuracy.
Automation greatly reduces this type of inefficiency and wasted effort.
Mistakes in process diagrams aren’t merely inconvenient or inefficient. Process flow errors can lead to inventory spoilage, product recalls, workplace accidents, and lawsuits.
Beyond just saving time, saving money and heartache are great reasons to automate work.
Automating Swimlane Diagrams for Your Organization
Automating swimlane diagrams is just one example of the technical challenges that we’re tackling at Tom Sawyer Software.
Stay tuned for upcoming announcements about new capabilities that put automated diagrams to work for your organization.
In the meantime, see demonstrations of our intelligent visualizations in action.
About the Author
Kristin Petersen is the Marketing Content Manager at Tom Sawyer Software. She has 17+ years of technical writing and editing experience in both the public and private sector, and transitioned into Marketing where she brings her strong technical background, writing experience, and creativity. She earned her Master of Science in Technical Communication from Drexel.
Submit a Comment